
 Yahoo Finance
 Be Wary Of TELUS (TSE:T) And Its Returns On Capital
If we want to find a stock that could multiply over the long term, what are the underlying trends we should look for? One common approach is to try and find a company with returns on capital employed (ROCE) that are increasing, in conjunction with a growing amount of capital employed. If you see this, it typically means it's a company with a great business model and plenty of profitable reinvestment opportunities. However, after investigating TELUS (TSE:T), we don't think it's current trends fit the mold of a multi-bagger.
Understanding Return On Capital Employed (ROCE)
For those that aren't sure what ROCE is, it measures the amount of pre-tax profits a company can generate from the capital employed in its business. Analysts use this formula to calculate it for TELUS:
Return on Capital Employed = Earnings Before Interest and Tax (EBIT) ÷ (Total Assets - Current Liabilities)
0.066 = CA$3.2b ÷ (CA$58b - CA$10b) (Based on the trailing twelve months to March 2024).
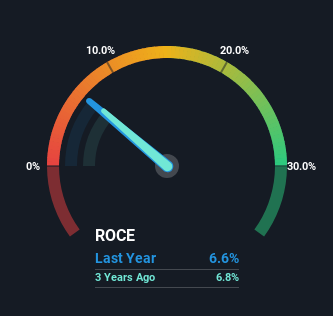
So, TELUS has an ROCE of 6.6%. In absolute terms, that's a low return and it also under-performs the Telecom industry average of 8.9%.
See our latest analysis for TELUS
In the above chart we have measured TELUS' prior ROCE against its prior performance, but the future is arguably more important. If you'd like to see what analysts are forecasting going forward, you should check out our free analyst report for TELUS .
What Does the ROCE Trend For TELUS Tell Us?
On the surface, the trend of ROCE at TELUS doesn't inspire confidence. Over the last five years, returns on capital have decreased to 6.6% from 10% five years ago. Meanwhile, the business is utilizing more capital but this hasn't moved the needle much in terms of sales in the past 12 months, so this could reflect longer term investments. It's worth keeping an eye on the company's earnings from here on to see if these investments do end up contributing to the bottom line.
Our Take On TELUS' ROCE
Bringing it all together, while we're somewhat encouraged by TELUS' reinvestment in its own business, we're aware that returns are shrinking. And investors may be recognizing these trends since the stock has only returned a total of 15% to shareholders over the last five years. As a result, if you're hunting for a multi-bagger, we think you'd have more luck elsewhere.
One final note, you should learn about the 6 warning signs we've spotted with TELUS (including 2 which are potentially serious) .
While TELUS may not currently earn the highest returns, we've compiled a list of companies that currently earn more than 25% return on equity. Check out this free list here.
Have feedback on this article? Concerned about the content? Get in touch with us directly. Alternatively, email editorial-team (at) simplywallst.com.
This article by Simply Wall St is general in nature. We provide commentary based on historical data and analyst forecasts only using an unbiased methodology and our articles are not intended to be financial advice. It does not constitute a recommendation to buy or sell any stock, and does not take account of your objectives, or your financial situation. We aim to bring you long-term focused analysis driven by fundamental data. Note that our analysis may not factor in the latest price-sensitive company announcements or qualitative material. Simply Wall St has no position in any stocks mentioned.
Have feedback on this article? Concerned about the content? Get in touch with us directly. Alternatively, email editorial-team@simplywallst.com
