
 Yahoo Finance
 Those who invested in Frontken Corporation Berhad (KLSE:FRONTKN) five years ago are up 447%
We think all investors should try to buy and hold high quality multi-year winners. While not every stock performs well, when investors win, they can win big. Just think about the savvy investors who held Frontken Corporation Berhad (KLSE:FRONTKN) shares for the last five years, while they gained 416%. This just goes to show the value creation that some businesses can achieve. Also pleasing for shareholders was the 20% gain in the last three months.
With that in mind, it's worth seeing if the company's underlying fundamentals have been the driver of long term performance, or if there are some discrepancies.
View our latest analysis for Frontken Corporation Berhad
To paraphrase Benjamin Graham: Over the short term the market is a voting machine, but over the long term it's a weighing machine. One flawed but reasonable way to assess how sentiment around a company has changed is to compare the earnings per share (EPS) with the share price.
During five years of share price growth, Frontken Corporation Berhad achieved compound earnings per share (EPS) growth of 14% per year. This EPS growth is slower than the share price growth of 39% per year, over the same period. This suggests that market participants hold the company in higher regard, these days. And that's hardly shocking given the track record of growth. This optimism is visible in its fairly high P/E ratio of 61.23.
The company's earnings per share (over time) is depicted in the image below (click to see the exact numbers).
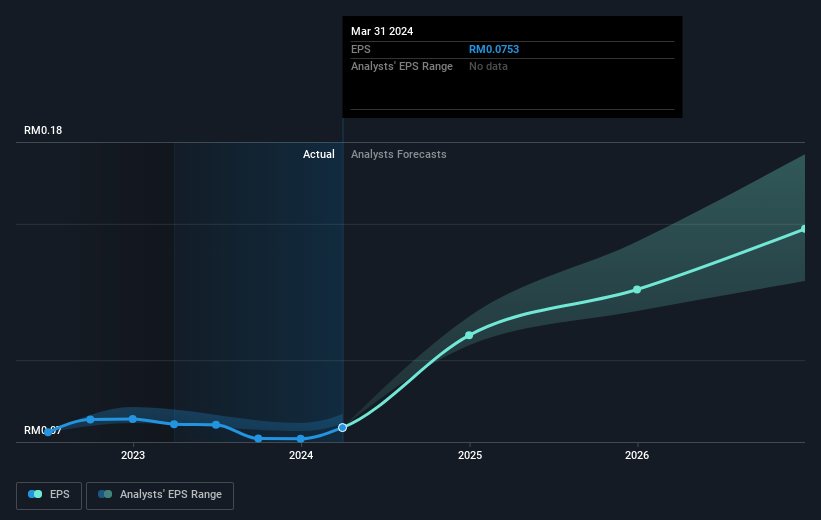
This free interactive report on Frontken Corporation Berhad's earnings, revenue and cash flow is a great place to start, if you want to investigate the stock further.
What About Dividends?
As well as measuring the share price return, investors should also consider the total shareholder return (TSR). Whereas the share price return only reflects the change in the share price, the TSR includes the value of dividends (assuming they were reinvested) and the benefit of any discounted capital raising or spin-off. Arguably, the TSR gives a more comprehensive picture of the return generated by a stock. We note that for Frontken Corporation Berhad the TSR over the last 5 years was 447%, which is better than the share price return mentioned above. And there's no prize for guessing that the dividend payments largely explain the divergence!
A Different Perspective
It's nice to see that Frontken Corporation Berhad shareholders have received a total shareholder return of 49% over the last year. And that does include the dividend. That gain is better than the annual TSR over five years, which is 40%. Therefore it seems like sentiment around the company has been positive lately. Someone with an optimistic perspective could view the recent improvement in TSR as indicating that the business itself is getting better with time. Is Frontken Corporation Berhad cheap compared to other companies? These 3 valuation measures might help you decide.
Of course Frontken Corporation Berhad may not be the best stock to buy. So you may wish to see this free collection of growth stocks.
Please note, the market returns quoted in this article reflect the market weighted average returns of stocks that currently trade on Malaysian exchanges.
Have feedback on this article? Concerned about the content? Get in touch with us directly. Alternatively, email editorial-team (at) simplywallst.com.
This article by Simply Wall St is general in nature. We provide commentary based on historical data and analyst forecasts only using an unbiased methodology and our articles are not intended to be financial advice. It does not constitute a recommendation to buy or sell any stock, and does not take account of your objectives, or your financial situation. We aim to bring you long-term focused analysis driven by fundamental data. Note that our analysis may not factor in the latest price-sensitive company announcements or qualitative material. Simply Wall St has no position in any stocks mentioned.
Have feedback on this article? Concerned about the content? Get in touch with us directly. Alternatively, email editorial-team@simplywallst.com
