
 Yahoo Finance
 There's Been No Shortage Of Growth Recently For AF Global's (SGX:L38) Returns On Capital
If we want to find a stock that could multiply over the long term, what are the underlying trends we should look for? Amongst other things, we'll want to see two things; firstly, a growing return on capital employed (ROCE) and secondly, an expansion in the company's amount of capital employed. If you see this, it typically means it's a company with a great business model and plenty of profitable reinvestment opportunities. So when we looked at AF Global (SGX:L38) and its trend of ROCE, we really liked what we saw.
Understanding Return On Capital Employed (ROCE)
For those that aren't sure what ROCE is, it measures the amount of pre-tax profits a company can generate from the capital employed in its business. Analysts use this formula to calculate it for AF Global:
Return on Capital Employed = Earnings Before Interest and Tax (EBIT) ÷ (Total Assets - Current Liabilities)
0.016 = S$4.9m ÷ (S$317m - S$21m) (Based on the trailing twelve months to December 2023).
Therefore, AF Global has an ROCE of 1.6%. In absolute terms, that's a low return and it also under-performs the Hospitality industry average of 4.5%.
Check out our latest analysis for AF Global
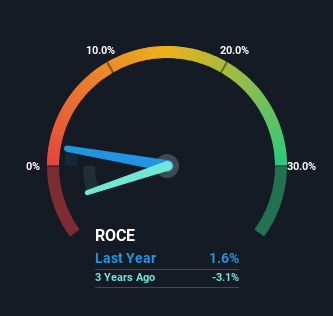
Historical performance is a great place to start when researching a stock so above you can see the gauge for AF Global's ROCE against it's prior returns. If you're interested in investigating AF Global's past further, check out this free graph covering AF Global's past earnings, revenue and cash flow.
What The Trend Of ROCE Can Tell Us
While the ROCE is still rather low for AF Global, we're glad to see it heading in the right direction. The data shows that returns on capital have increased by 1,826% over the trailing five years. The company is now earning S$0.02 per dollar of capital employed. Interestingly, the business may be becoming more efficient because it's applying 23% less capital than it was five years ago. If this trend continues, the business might be getting more efficient but it's shrinking in terms of total assets.
On a related note, the company's ratio of current liabilities to total assets has decreased to 6.8%, which basically reduces it's funding from the likes of short-term creditors or suppliers. So this improvement in ROCE has come from the business' underlying economics, which is great to see.
The Key Takeaway
In summary, it's great to see that AF Global has been able to turn things around and earn higher returns on lower amounts of capital. And since the stock has fallen 36% over the last five years, there might be an opportunity here. So researching this company further and determining whether or not these trends will continue seems justified.
AF Global does have some risks though, and we've spotted 1 warning sign for AF Global that you might be interested in.
For those who like to invest in solid companies, check out this free list of companies with solid balance sheets and high returns on equity.
Have feedback on this article? Concerned about the content? Get in touch with us directly. Alternatively, email editorial-team (at) simplywallst.com.
This article by Simply Wall St is general in nature. We provide commentary based on historical data and analyst forecasts only using an unbiased methodology and our articles are not intended to be financial advice. It does not constitute a recommendation to buy or sell any stock, and does not take account of your objectives, or your financial situation. We aim to bring you long-term focused analysis driven by fundamental data. Note that our analysis may not factor in the latest price-sensitive company announcements or qualitative material. Simply Wall St has no position in any stocks mentioned.
Have feedback on this article? Concerned about the content? Get in touch with us directly. Alternatively, email editorial-team@simplywallst.com
