
 Yahoo Finance
 Shareholders in Hansen Technologies (ASX:HSN) are in the red if they invested three years ago
Many investors define successful investing as beating the market average over the long term. But its virtually certain that sometimes you will buy stocks that fall short of the market average returns. Unfortunately, that's been the case for longer term Hansen Technologies Limited (ASX:HSN) shareholders, since the share price is down 30% in the last three years, falling well short of the market return of around 19%.
It's worthwhile assessing if the company's economics have been moving in lockstep with these underwhelming shareholder returns, or if there is some disparity between the two. So let's do just that.
View our latest analysis for Hansen Technologies
To paraphrase Benjamin Graham: Over the short term the market is a voting machine, but over the long term it's a weighing machine. One imperfect but simple way to consider how the market perception of a company has shifted is to compare the change in the earnings per share (EPS) with the share price movement.
During the unfortunate three years of share price decline, Hansen Technologies actually saw its earnings per share (EPS) improve by 3.8% per year. Given the share price reaction, one might suspect that EPS is not a good guide to the business performance during the period (perhaps due to a one-off loss or gain). Or else the company was over-hyped in the past, and so its growth has disappointed.
It's pretty reasonable to suspect the market was previously to bullish on the stock, and has since moderated expectations. But it's possible a look at other metrics will be enlightening.
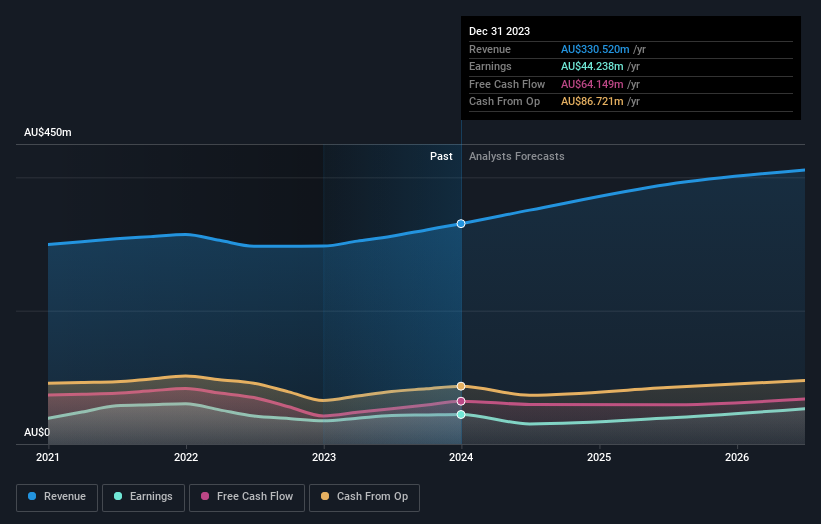
With revenue flat over three years, it seems unlikely that the share price is reflecting the top line. There doesn't seem to be any clear correlation between the fundamental business metrics and the share price. That could mean that the stock was previously overrated, or it could spell opportunity now.
The graphic below depicts how earnings and revenue have changed over time (unveil the exact values by clicking on the image).
We know that Hansen Technologies has improved its bottom line lately, but what does the future have in store? You can see what analysts are predicting for Hansen Technologies in this interactive graph of future profit estimates.
What About Dividends?
When looking at investment returns, it is important to consider the difference between total shareholder return (TSR) and share price return. The TSR is a return calculation that accounts for the value of cash dividends (assuming that any dividend received was reinvested) and the calculated value of any discounted capital raisings and spin-offs. So for companies that pay a generous dividend, the TSR is often a lot higher than the share price return. As it happens, Hansen Technologies' TSR for the last 3 years was -25%, which exceeds the share price return mentioned earlier. The dividends paid by the company have thusly boosted the total shareholder return.
A Different Perspective
Hansen Technologies shareholders are down 11% for the year (even including dividends), but the market itself is up 15%. However, keep in mind that even the best stocks will sometimes underperform the market over a twelve month period. On the bright side, long term shareholders have made money, with a gain of 5% per year over half a decade. It could be that the recent sell-off is an opportunity, so it may be worth checking the fundamental data for signs of a long term growth trend. Before spending more time on Hansen Technologies it might be wise to click here to see if insiders have been buying or selling shares.
If you would prefer to check out another company -- one with potentially superior financials -- then do not miss this free list of companies that have proven they can grow earnings.
Please note, the market returns quoted in this article reflect the market weighted average returns of stocks that currently trade on Australian exchanges.
Have feedback on this article? Concerned about the content? Get in touch with us directly. Alternatively, email editorial-team (at) simplywallst.com.
This article by Simply Wall St is general in nature. We provide commentary based on historical data and analyst forecasts only using an unbiased methodology and our articles are not intended to be financial advice. It does not constitute a recommendation to buy or sell any stock, and does not take account of your objectives, or your financial situation. We aim to bring you long-term focused analysis driven by fundamental data. Note that our analysis may not factor in the latest price-sensitive company announcements or qualitative material. Simply Wall St has no position in any stocks mentioned.
Have feedback on this article? Concerned about the content? Get in touch with us directly. Alternatively, email editorial-team@simplywallst.com
