
 Yahoo Finance
 Kumpulan Kitacon Berhad (KLSE:KITACON) Will Want To Turn Around Its Return Trends
To find a multi-bagger stock, what are the underlying trends we should look for in a business? One common approach is to try and find a company with returns on capital employed (ROCE) that are increasing, in conjunction with a growing amount of capital employed. If you see this, it typically means it's a company with a great business model and plenty of profitable reinvestment opportunities. Although, when we looked at Kumpulan Kitacon Berhad (KLSE:KITACON), it didn't seem to tick all of these boxes.
What Is Return On Capital Employed (ROCE)?
If you haven't worked with ROCE before, it measures the 'return' (pre-tax profit) a company generates from capital employed in its business. To calculate this metric for Kumpulan Kitacon Berhad, this is the formula:
Return on Capital Employed = Earnings Before Interest and Tax (EBIT) ÷ (Total Assets - Current Liabilities)
0.15 = RM47m ÷ (RM581m - RM276m) (Based on the trailing twelve months to March 2024).
So, Kumpulan Kitacon Berhad has an ROCE of 15%. On its own, that's a standard return, however it's much better than the 7.7% generated by the Construction industry.
View our latest analysis for Kumpulan Kitacon Berhad
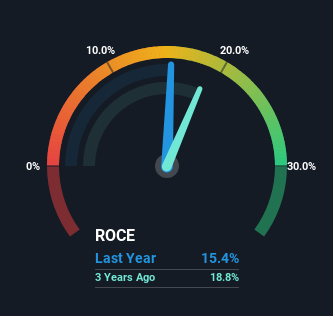
Historical performance is a great place to start when researching a stock so above you can see the gauge for Kumpulan Kitacon Berhad's ROCE against it's prior returns. If you're interested in investigating Kumpulan Kitacon Berhad's past further, check out this free graph covering Kumpulan Kitacon Berhad's past earnings, revenue and cash flow.
So How Is Kumpulan Kitacon Berhad's ROCE Trending?
In terms of Kumpulan Kitacon Berhad's historical ROCE movements, the trend isn't fantastic. Over the last four years, returns on capital have decreased to 15% from 24% four years ago. Although, given both revenue and the amount of assets employed in the business have increased, it could suggest the company is investing in growth, and the extra capital has led to a short-term reduction in ROCE. If these investments prove successful, this can bode very well for long term stock performance.
On a separate but related note, it's important to know that Kumpulan Kitacon Berhad has a current liabilities to total assets ratio of 47%, which we'd consider pretty high. This effectively means that suppliers (or short-term creditors) are funding a large portion of the business, so just be aware that this can introduce some elements of risk. Ideally we'd like to see this reduce as that would mean fewer obligations bearing risks.
The Key Takeaway
In summary, despite lower returns in the short term, we're encouraged to see that Kumpulan Kitacon Berhad is reinvesting for growth and has higher sales as a result. And the stock has followed suit returning a meaningful 17% to shareholders over the last year. So should these growth trends continue, we'd be optimistic on the stock going forward.
Kumpulan Kitacon Berhad does have some risks, we noticed 5 warning signs (and 2 which make us uncomfortable) we think you should know about.
If you want to search for solid companies with great earnings, check out this free list of companies with good balance sheets and impressive returns on equity.
Have feedback on this article? Concerned about the content? Get in touch with us directly. Alternatively, email editorial-team (at) simplywallst.com.
This article by Simply Wall St is general in nature. We provide commentary based on historical data and analyst forecasts only using an unbiased methodology and our articles are not intended to be financial advice. It does not constitute a recommendation to buy or sell any stock, and does not take account of your objectives, or your financial situation. We aim to bring you long-term focused analysis driven by fundamental data. Note that our analysis may not factor in the latest price-sensitive company announcements or qualitative material. Simply Wall St has no position in any stocks mentioned.
Have feedback on this article? Concerned about the content? Get in touch with us directly. Alternatively, email editorial-team@simplywallst.com
