
 Yahoo Finance
 June 2024's Top Three Japanese Dividend Stocks
Amidst a backdrop of heightened uncertainty regarding the Bank of Japan's monetary policy direction and a weakening yen, Japan's stock markets have experienced some turbulence recently. In such an environment, dividend stocks can offer investors potential stability and regular income, making them an appealing option for those looking to navigate through fluctuating market conditions.
Top 10 Dividend Stocks In Japan
Name | Dividend Yield | Dividend Rating |
Yamato Kogyo (TSE:5444) | 3.90% | ★★★★★★ |
Business Brain Showa-Ota (TSE:9658) | 3.62% | ★★★★★★ |
Mitsubishi Shokuhin (TSE:7451) | 3.47% | ★★★★★★ |
Nihon Tokushu Toryo (TSE:4619) | 3.93% | ★★★★★★ |
Globeride (TSE:7990) | 3.72% | ★★★★★★ |
HITO-Communications HoldingsInc (TSE:4433) | 3.48% | ★★★★★★ |
FALCO HOLDINGS (TSE:4671) | 6.77% | ★★★★★★ |
KurimotoLtd (TSE:5602) | 5.20% | ★★★★★★ |
GakkyushaLtd (TSE:9769) | 4.18% | ★★★★★★ |
Innotech (TSE:9880) | 4.04% | ★★★★★★ |
Click here to see the full list of 395 stocks from our Top Dividend Stocks screener.
We'll examine a selection from our screener results.
UT GroupLtd
Simply Wall St Dividend Rating: ★★★★☆☆
Overview: UT Group Co., Ltd. operates in Japan, focusing on the dispatch and outsourcing of permanent employees across various sectors including manufacturing, design and development, and construction, with a market capitalization of approximately ¥121.87 billion.
Operations: UT Group Co., Ltd. generates revenue through its Area Business (¥63.52 billion), Foreign Operation (¥10.91 billion), Solution Business (¥17.89 billion), Engineering Business (¥9.30 billion), and Manufacturing Business excluding Solution Business (¥65.46 billion).
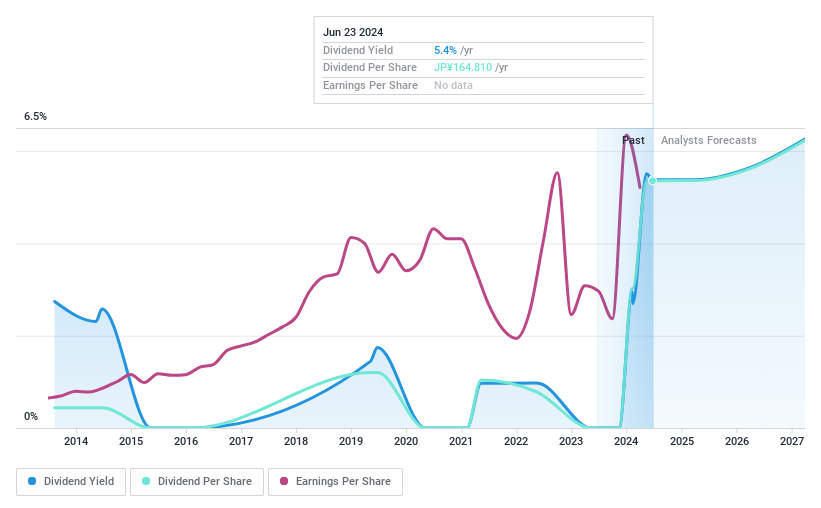
Dividend Yield: 5.4%
UT Group Co. Ltd., known for its JPY 3.82 billion dividend payout effective June 24, 2024, reflects a mixed stance on dividend sustainability. Despite a notable growth in earnings by 66% over the past year and a forecasted annual earnings increase of 23.94%, the company's dividends face challenges with coverage. The cash payout ratio stands high at 265.7%, indicating that dividends are not well supported by cash flows, coupled with volatility in past dividend payments, highlighting potential concerns for long-term reliability despite a current yield of 5.38%.
Nissan Chemical
Simply Wall St Dividend Rating: ★★★★☆☆
Overview: Nissan Chemical Corporation operates in the chemicals, performance materials, agricultural chemicals, and pharmaceuticals sectors both in Japan and globally, with a market capitalization of approximately ¥674.96 billion.
Operations: Nissan Chemical Corporation's revenue is primarily derived from its trading (¥103.79 billion), performance materials (¥84.57 billion), agricultural chemicals (¥82.11 billion), chemical business (¥35.56 billion), and healthcare segments (¥6.30 billion).
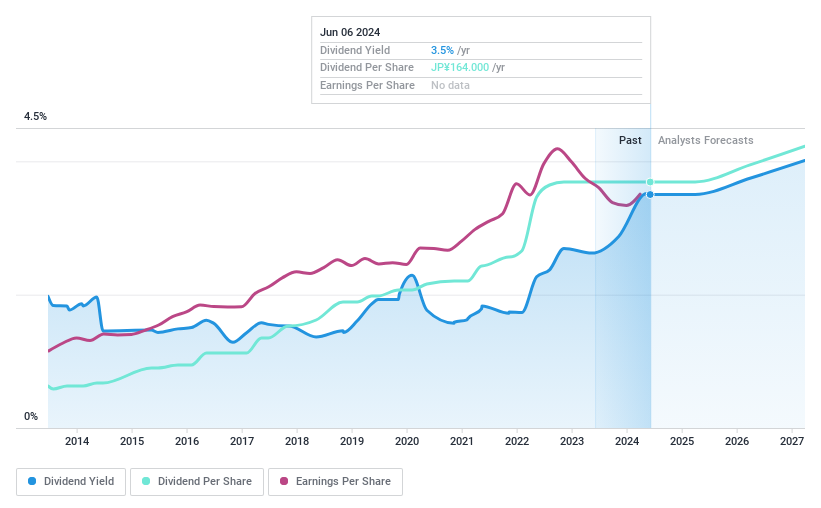
Dividend Yield: 3.4%
Nissan Chemical, with a dividend yield of 3.36%, shows a mixed outlook for dividend investors. While the company has maintained stable dividends over the past decade and recently increased its buyback plan to ¥10 billion, challenges persist. Its dividends are not fully covered by earnings or free cash flow, reflecting a high cash payout ratio of 167.6%. Recent board decisions aim to expand shareholder returns amidst changing market conditions, indicating an adaptive but cautious capital management strategy.
Okinawa Cellular Telephone
Simply Wall St Dividend Rating: ★★★★☆☆
Overview: Okinawa Cellular Telephone Company operates primarily in Japan, offering telecommunication and mobile phone services with a market capitalization of approximately ¥186.92 billion.
Operations: Okinawa Cellular Telephone Company generates its revenue primarily from telecommunication and mobile phone services in Japan.
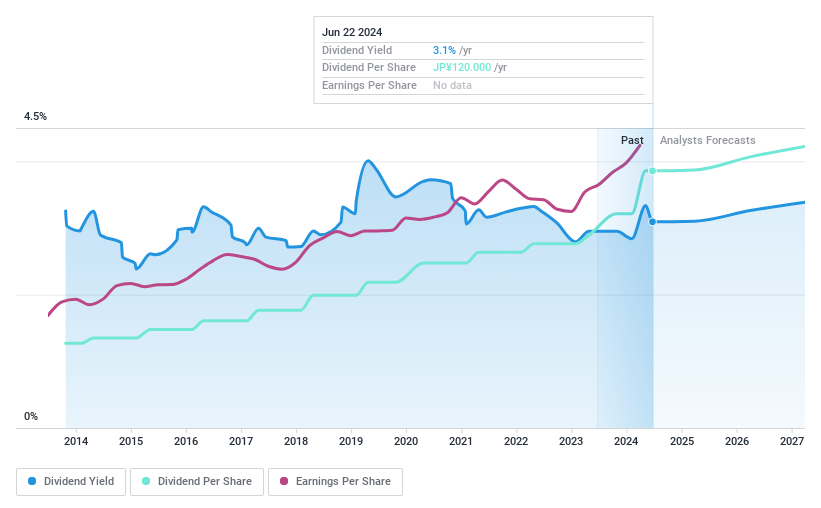
Dividend Yield: 3.1%
Okinawa Cellular Telephone has maintained stable dividends over the past decade and recently announced a share repurchase program to buy back up to ¥4 billion worth of shares by April 2025, signaling a commitment to shareholder returns. Despite a reasonable payout ratio of 60.1%, its dividend yield at 3.09% is lower than the top quartile in Japan's market. Challenges include dividends not being well covered by cash flows, with a high cash payout ratio of 329.2%.
Seize The Opportunity
Reveal the 395 hidden gems among our Top Dividend Stocks screener with a single click here.
Already own these companies? Link your portfolio to Simply Wall St and get alerts on any new warning signs to your stocks.
Join a community of smart investors by using Simply Wall St. It's free and delivers expert-level analysis on worldwide markets.
Contemplating Other Strategies?
Explore high-performing small cap companies that haven't yet garnered significant analyst attention.
Fuel your portfolio with companies showing strong growth potential, backed by optimistic outlooks both from analysts and management.
Find companies with promising cash flow potential yet trading below their fair value.
This article by Simply Wall St is general in nature. We provide commentary based on historical data and analyst forecasts only using an unbiased methodology and our articles are not intended to be financial advice. It does not constitute a recommendation to buy or sell any stock, and does not take account of your objectives, or your financial situation. We aim to bring you long-term focused analysis driven by fundamental data. Note that our analysis may not factor in the latest price-sensitive company announcements or qualitative material. Simply Wall St has no position in any stocks mentioned.
Companies discussed in this article include TSE:2146 TSE:4021 and TSE:9436.
Have feedback on this article? Concerned about the content? Get in touch with us directly. Alternatively, email editorial-team@simplywallst.com
