
 Yahoo Finance
 Investors Will Want NiSource's (NYSE:NI) Growth In ROCE To Persist
If we want to find a potential multi-bagger, often there are underlying trends that can provide clues. Firstly, we'll want to see a proven return on capital employed (ROCE) that is increasing, and secondly, an expanding base of capital employed. This shows us that it's a compounding machine, able to continually reinvest its earnings back into the business and generate higher returns. So when we looked at NiSource (NYSE:NI) and its trend of ROCE, we really liked what we saw.
Return On Capital Employed (ROCE): What Is It?
For those who don't know, ROCE is a measure of a company's yearly pre-tax profit (its return), relative to the capital employed in the business. The formula for this calculation on NiSource is:
Return on Capital Employed = Earnings Before Interest and Tax (EBIT) ÷ (Total Assets - Current Liabilities)
0.051 = US$1.3b ÷ (US$29b - US$3.1b) (Based on the trailing twelve months to March 2024).
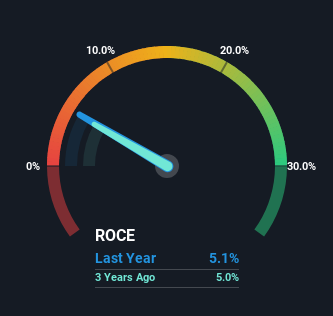
Therefore, NiSource has an ROCE of 5.1%. Even though it's in line with the industry average of 5.0%, it's still a low return by itself.
Check out our latest analysis for NiSource
Above you can see how the current ROCE for NiSource compares to its prior returns on capital, but there's only so much you can tell from the past. If you'd like to see what analysts are forecasting going forward, you should check out our free analyst report for NiSource .
What Does the ROCE Trend For NiSource Tell Us?
While in absolute terms it isn't a high ROCE, it's promising to see that it has been moving in the right direction. Over the last five years, returns on capital employed have risen substantially to 5.1%. The company is effectively making more money per dollar of capital used, and it's worth noting that the amount of capital has increased too, by 47%. This can indicate that there's plenty of opportunities to invest capital internally and at ever higher rates, a combination that's common among multi-baggers.
In Conclusion...
All in all, it's terrific to see that NiSource is reaping the rewards from prior investments and is growing its capital base. Since the stock has only returned 18% to shareholders over the last five years, the promising fundamentals may not be recognized yet by investors. So exploring more about this stock could uncover a good opportunity, if the valuation and other metrics stack up.
NiSource does come with some risks though, we found 3 warning signs in our investment analysis, and 1 of those is a bit unpleasant...
If you want to search for solid companies with great earnings, check out this free list of companies with good balance sheets and impressive returns on equity.
Have feedback on this article? Concerned about the content? Get in touch with us directly. Alternatively, email editorial-team (at) simplywallst.com.
This article by Simply Wall St is general in nature. We provide commentary based on historical data and analyst forecasts only using an unbiased methodology and our articles are not intended to be financial advice. It does not constitute a recommendation to buy or sell any stock, and does not take account of your objectives, or your financial situation. We aim to bring you long-term focused analysis driven by fundamental data. Note that our analysis may not factor in the latest price-sensitive company announcements or qualitative material. Simply Wall St has no position in any stocks mentioned.
Have feedback on this article? Concerned about the content? Get in touch with us directly. Alternatively, email editorial-team@simplywallst.com
