
 Yahoo Finance
 Immersion's (NASDAQ:IMMR) investors will be pleased with their decent 52% return over the last year
If you want to compound wealth in the stock market, you can do so by buying an index fund. But investors can boost returns by picking market-beating companies to own shares in. For example, the Immersion Corporation (NASDAQ:IMMR) share price is up 49% in the last 1 year, clearly besting the market return of around 22% (not including dividends). So that should have shareholders smiling. The longer term returns have not been as good, with the stock price only 26% higher than it was three years ago.
So let's assess the underlying fundamentals over the last 1 year and see if they've moved in lock-step with shareholder returns.
See our latest analysis for Immersion
In his essay The Superinvestors of Graham-and-Doddsville Warren Buffett described how share prices do not always rationally reflect the value of a business. By comparing earnings per share (EPS) and share price changes over time, we can get a feel for how investor attitudes to a company have morphed over time.
Immersion was able to grow EPS by 36% in the last twelve months. This EPS growth is significantly lower than the 49% increase in the share price. This indicates that the market is now more optimistic about the stock.
You can see below how EPS has changed over time (discover the exact values by clicking on the image).
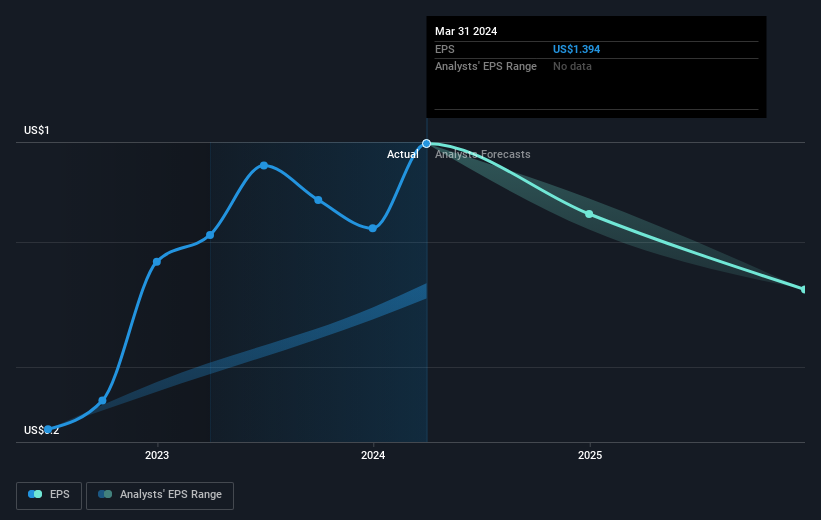
It is of course excellent to see how Immersion has grown profits over the years, but the future is more important for shareholders. This free interactive report on Immersion's balance sheet strength is a great place to start, if you want to investigate the stock further.
What About Dividends?
It is important to consider the total shareholder return, as well as the share price return, for any given stock. The TSR is a return calculation that accounts for the value of cash dividends (assuming that any dividend received was reinvested) and the calculated value of any discounted capital raisings and spin-offs. It's fair to say that the TSR gives a more complete picture for stocks that pay a dividend. In the case of Immersion, it has a TSR of 52% for the last 1 year. That exceeds its share price return that we previously mentioned. This is largely a result of its dividend payments!
A Different Perspective
It's good to see that Immersion has rewarded shareholders with a total shareholder return of 52% in the last twelve months. Of course, that includes the dividend. That's better than the annualised return of 8% over half a decade, implying that the company is doing better recently. Given the share price momentum remains strong, it might be worth taking a closer look at the stock, lest you miss an opportunity. It's always interesting to track share price performance over the longer term. But to understand Immersion better, we need to consider many other factors. Take risks, for example - Immersion has 4 warning signs (and 1 which is significant) we think you should know about.
For those who like to find winning investments this free list of undervalued companies with recent insider purchasing, could be just the ticket.
Please note, the market returns quoted in this article reflect the market weighted average returns of stocks that currently trade on American exchanges.
Have feedback on this article? Concerned about the content? Get in touch with us directly. Alternatively, email editorial-team (at) simplywallst.com.
This article by Simply Wall St is general in nature. We provide commentary based on historical data and analyst forecasts only using an unbiased methodology and our articles are not intended to be financial advice. It does not constitute a recommendation to buy or sell any stock, and does not take account of your objectives, or your financial situation. We aim to bring you long-term focused analysis driven by fundamental data. Note that our analysis may not factor in the latest price-sensitive company announcements or qualitative material. Simply Wall St has no position in any stocks mentioned.
Have feedback on this article? Concerned about the content? Get in touch with us directly. Alternatively, email editorial-team@simplywallst.com
