
 Yahoo Finance
 Declining Stock and Solid Fundamentals: Is The Market Wrong About Johns Lyng Group Limited (ASX:JLG)?
With its stock down 5.7% over the past three months, it is easy to disregard Johns Lyng Group (ASX:JLG). However, stock prices are usually driven by a company’s financial performance over the long term, which in this case looks quite promising. Specifically, we decided to study Johns Lyng Group's ROE in this article.
Return on equity or ROE is an important factor to be considered by a shareholder because it tells them how effectively their capital is being reinvested. In simpler terms, it measures the profitability of a company in relation to shareholder's equity.
Check out our latest analysis for Johns Lyng Group
How To Calculate Return On Equity?
The formula for return on equity is:
Return on Equity = Net Profit (from continuing operations) ÷ Shareholders' Equity
So, based on the above formula, the ROE for Johns Lyng Group is:
13% = AU$60m ÷ AU$460m (Based on the trailing twelve months to December 2023).
The 'return' is the amount earned after tax over the last twelve months. So, this means that for every A$1 of its shareholder's investments, the company generates a profit of A$0.13.
What Has ROE Got To Do With Earnings Growth?
We have already established that ROE serves as an efficient profit-generating gauge for a company's future earnings. Based on how much of its profits the company chooses to reinvest or "retain", we are then able to evaluate a company's future ability to generate profits. Assuming everything else remains unchanged, the higher the ROE and profit retention, the higher the growth rate of a company compared to companies that don't necessarily bear these characteristics.
A Side By Side comparison of Johns Lyng Group's Earnings Growth And 13% ROE
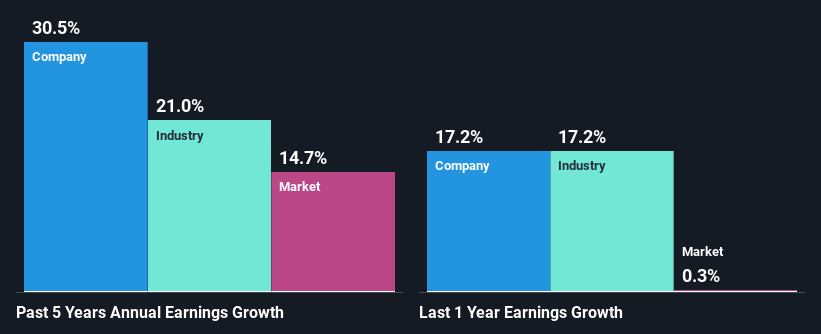
To begin with, Johns Lyng Group seems to have a respectable ROE. Further, the company's ROE is similar to the industry average of 13%. Consequently, this likely laid the ground for the impressive net income growth of 31% seen over the past five years by Johns Lyng Group. However, there could also be other drivers behind this growth. For instance, the company has a low payout ratio or is being managed efficiently.
As a next step, we compared Johns Lyng Group's net income growth with the industry, and pleasingly, we found that the growth seen by the company is higher than the average industry growth of 21%.
Earnings growth is an important metric to consider when valuing a stock. What investors need to determine next is if the expected earnings growth, or the lack of it, is already built into the share price. By doing so, they will have an idea if the stock is headed into clear blue waters or if swampy waters await. Is Johns Lyng Group fairly valued compared to other companies? These 3 valuation measures might help you decide.
Is Johns Lyng Group Efficiently Re-investing Its Profits?
Johns Lyng Group has a significant three-year median payout ratio of 56%, meaning the company only retains 44% of its income. This implies that the company has been able to achieve high earnings growth despite returning most of its profits to shareholders.
Moreover, Johns Lyng Group is determined to keep sharing its profits with shareholders which we infer from its long history of six years of paying a dividend. Based on the latest analysts' estimates, we found that the company's future payout ratio over the next three years is expected to hold steady at 47%. Accordingly, forecasts suggest that Johns Lyng Group's future ROE will be 15% which is again, similar to the current ROE.
Conclusion
On the whole, we feel that Johns Lyng Group's performance has been quite good. In particular, its high ROE is quite noteworthy and also the probable explanation behind its considerable earnings growth. Yet, the company is retaining a small portion of its profits. Which means that the company has been able to grow its earnings in spite of it, so that's not too bad. Having said that, the company's earnings growth is expected to slow down, as forecasted in the current analyst estimates. To know more about the company's future earnings growth forecasts take a look at this free report on analyst forecasts for the company to find out more.
Have feedback on this article? Concerned about the content? Get in touch with us directly. Alternatively, email editorial-team (at) simplywallst.com.
This article by Simply Wall St is general in nature. We provide commentary based on historical data and analyst forecasts only using an unbiased methodology and our articles are not intended to be financial advice. It does not constitute a recommendation to buy or sell any stock, and does not take account of your objectives, or your financial situation. We aim to bring you long-term focused analysis driven by fundamental data. Note that our analysis may not factor in the latest price-sensitive company announcements or qualitative material. Simply Wall St has no position in any stocks mentioned.
Have feedback on this article? Concerned about the content? Get in touch with us directly. Alternatively, email editorial-team@simplywallst.com
