
 Yahoo Finance
 Capital Investments At Steel Dynamics (NASDAQ:STLD) Point To A Promising Future
If you're not sure where to start when looking for the next multi-bagger, there are a few key trends you should keep an eye out for. One common approach is to try and find a company with returns on capital employed (ROCE) that are increasing, in conjunction with a growing amount of capital employed. If you see this, it typically means it's a company with a great business model and plenty of profitable reinvestment opportunities. So, when we ran our eye over Steel Dynamics' (NASDAQ:STLD) trend of ROCE, we really liked what we saw.
What Is Return On Capital Employed (ROCE)?
If you haven't worked with ROCE before, it measures the 'return' (pre-tax profit) a company generates from capital employed in its business. To calculate this metric for Steel Dynamics, this is the formula:
Return on Capital Employed = Earnings Before Interest and Tax (EBIT) ÷ (Total Assets - Current Liabilities)
0.24 = US$3.1b ÷ (US$15b - US$2.3b) (Based on the trailing twelve months to March 2024).
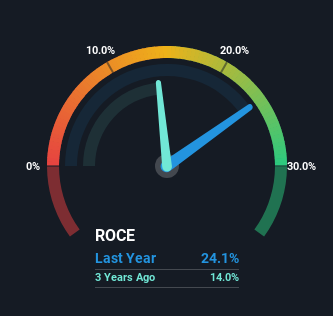
Thus, Steel Dynamics has an ROCE of 24%. In absolute terms that's a great return and it's even better than the Metals and Mining industry average of 8.9%.
Check out our latest analysis for Steel Dynamics
Above you can see how the current ROCE for Steel Dynamics compares to its prior returns on capital, but there's only so much you can tell from the past. If you'd like to see what analysts are forecasting going forward, you should check out our free analyst report for Steel Dynamics .
What The Trend Of ROCE Can Tell Us
In terms of Steel Dynamics' history of ROCE, it's quite impressive. The company has consistently earned 24% for the last five years, and the capital employed within the business has risen 86% in that time. Now considering ROCE is an attractive 24%, this combination is actually pretty appealing because it means the business can consistently put money to work and generate these high returns. If these trends can continue, it wouldn't surprise us if the company became a multi-bagger.
Our Take On Steel Dynamics' ROCE
Steel Dynamics has demonstrated its proficiency by generating high returns on increasing amounts of capital employed, which we're thrilled about. And the stock has done incredibly well with a 372% return over the last five years, so long term investors are no doubt ecstatic with that result. So even though the stock might be more "expensive" than it was before, we think the strong fundamentals warrant this stock for further research.
Steel Dynamics does have some risks, we noticed 2 warning signs (and 1 which doesn't sit too well with us) we think you should know about.
High returns are a key ingredient to strong performance, so check out our free list ofstocks earning high returns on equity with solid balance sheets.
Have feedback on this article? Concerned about the content? Get in touch with us directly. Alternatively, email editorial-team (at) simplywallst.com.
This article by Simply Wall St is general in nature. We provide commentary based on historical data and analyst forecasts only using an unbiased methodology and our articles are not intended to be financial advice. It does not constitute a recommendation to buy or sell any stock, and does not take account of your objectives, or your financial situation. We aim to bring you long-term focused analysis driven by fundamental data. Note that our analysis may not factor in the latest price-sensitive company announcements or qualitative material. Simply Wall St has no position in any stocks mentioned.
Have feedback on this article? Concerned about the content? Get in touch with us directly. Alternatively, email editorial-team@simplywallst.com
