
 Yahoo Finance
 Three Stocks That May Be Trading Below Their Estimated Value In June 2024
As global markets exhibit varied performance with the S&P 500 reaching new heights and sectors like manufacturing showing robust growth, investors may find opportunities in stocks that seem undervalued relative to their potential. In this context, understanding the fundamentals of a company and its market position becomes crucial in identifying stocks that may be trading below their estimated value.
Top 10 Undervalued Stocks Based On Cash Flows
Name | Current Price | Fair Value (Est) | Discount (Est) |
Calian Group (TSX:CGY) | CA$55.44 | CA$110.53 | 49.8% |
Kuo Toong International (TPEX:8936) | NT$75.90 | NT$151.30 | 49.8% |
OSAKA Titanium technologiesLtd (TSE:5726) | ¥2779.00 | ¥5531.93 | 49.8% |
Componenta (HLSE:CTH1V) | €3.05 | €6.08 | 49.8% |
USCB Financial Holdings (NasdaqGM:USCB) | US$11.88 | US$23.66 | 49.8% |
Interojo (KOSDAQ:A119610) | ₩24900.00 | ₩49600.74 | 49.8% |
Musti Group Oyj (HLSE:MUSTI) | €25.40 | €50.68 | 49.9% |
Nexxen International (AIM:NEXN) | £2.47 | £4.92 | 49.8% |
Galderma Group (SWX:GALD) | CHF74.86 | CHF149.55 | 49.9% |
eEnergy Group (AIM:EAAS) | £0.055 | £0.11 | 49.8% |
Let's take a closer look at a couple of our picks from the screened companies
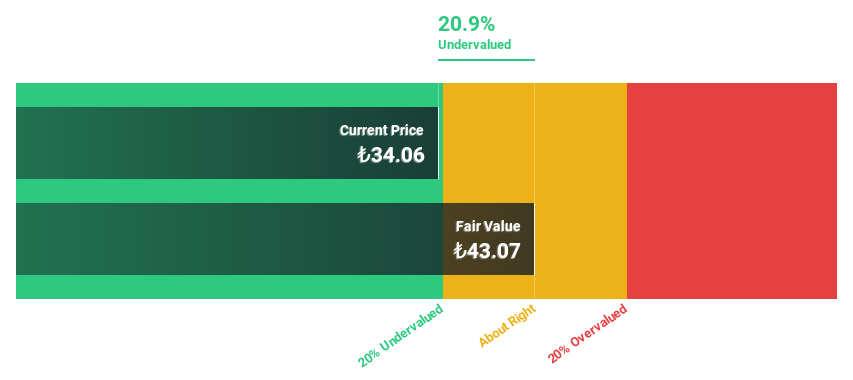
Yapi ve Kredi Bankasi
Overview: Yapi ve Kredi Bankasi A.S., along with its subsidiaries, offers a range of banking products and services both in Turkey and internationally, with a market capitalization of approximately TRY 287.71 billion.
Operations: The company generates revenue through several segments, with TRY 69.08 billion from Retail Banking (including Private Banking and Wealth Management), TRY 48.89 billion from Commercial and SME Banking, TRY 20.86 billion from Treasury, Asset Liability Management and Other, TRY 13.39 billion from Corporate Banking, TRY 10.41 billion from Other Domestic Operations, and TRY 3.95 billion from Other Foreign Operations.
Estimated Discount To Fair Value: 20.9%
Yapi ve Kredi Bankasi (YKBNK) is currently trading below its fair value by over 20%, with a significant discount on cash flow valuation. Despite a high level of bad loans at 2.6%, YKBNK's revenue growth is robust, forecasted at 32.3% annually, outpacing the Turkish market average. However, its earnings growth lags slightly behind the market forecast. Recent M&A discussions have highlighted valuation challenges, impacting its stock performance and investor perceptions around its pricing strategy.
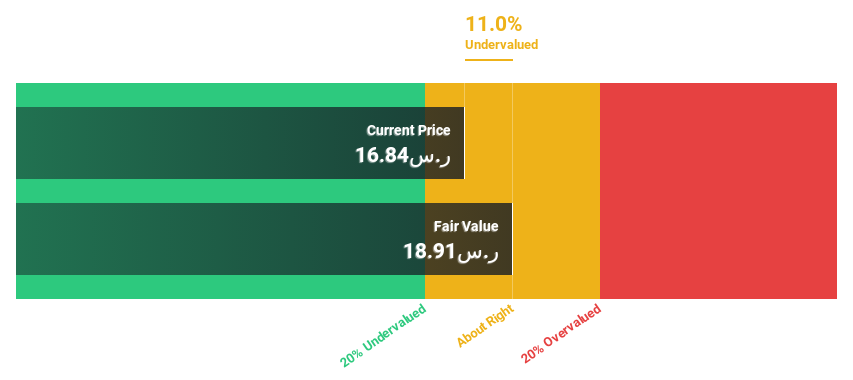
Saudi Electricity
Overview: Saudi Electricity Company operates in the Kingdom of Saudi Arabia, where it generates, transmits, and distributes electricity to a diverse range of consumers including governmental and residential sectors; it has a market capitalization of approximately SAR 68.42 billion.
Operations: The company's revenue is primarily derived from two segments: the National Grid Company, which contributes SAR 26.10 billion, and its main operations, contributing SAR 71.69 billion.
Estimated Discount To Fair Value: 11%
Saudi Electricity's recent earnings show a rise in sales to SAR 15.86 billion and net income to SAR 897 million, reflecting improved performance. Trading at SAR 16.84, below the estimated fair value of SAR 18.91, it appears modestly undervalued based on cash flows. However, its dividend sustainability is questionable as dividends are not well-covered by earnings or cash flow. While revenue growth projections are modest at 3.9% annually, earnings are expected to surge by approximately 44.8% per year.
Our growth report here indicates Saudi Electricity may be poised for an improving outlook.
Click here to discover the nuances of Saudi Electricity with our detailed financial health report.
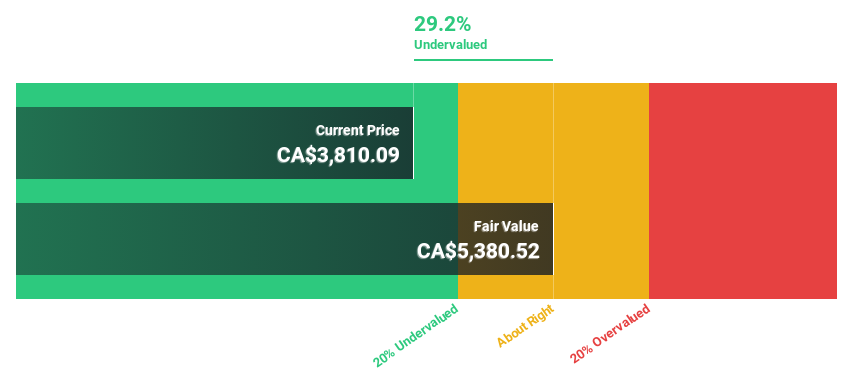
Constellation Software
Overview: Constellation Software Inc. operates globally, focusing on acquiring, building, and managing vertical market software businesses primarily in Canada, the United States, and Europe, with a market capitalization of approximately CA$80.74 billion.
Operations: The company's revenue from its software and programming segment is approximately CA$8.84 billion.
Estimated Discount To Fair Value: 29.2%
Constellation Software, priced at CA$3810.09, is considered undervalued with a fair value estimate of CA$5380.52, reflecting a 29.2% discount. The company's earnings are poised for robust growth at 24.43% annually over the next three years, outpacing the Canadian market's 14.7%. Despite high debt levels and significant insider selling recently, revenue growth also exceeds market expectations at 16.1% annually compared to the market’s 7.2%. Recent executive changes within its Harris operating group could influence future strategic directions and performance.
Where To Now?
Investigate our full lineup of 954 Undervalued Stocks Based On Cash Flows right here.
Invested in any of these stocks? Simplify your portfolio management with Simply Wall St and stay ahead with our alerts for any critical updates on your stocks.
Elevate your portfolio with Simply Wall St, the ultimate app for investors seeking global market coverage.
Ready To Venture Into Other Investment Styles?
Explore high-performing small cap companies that haven't yet garnered significant analyst attention.
Diversify your portfolio with solid dividend payers offering reliable income streams to weather potential market turbulence.
Fuel your portfolio with companies showing strong growth potential, backed by optimistic outlooks both from analysts and management.
This article by Simply Wall St is general in nature. We provide commentary based on historical data and analyst forecasts only using an unbiased methodology and our articles are not intended to be financial advice. It does not constitute a recommendation to buy or sell any stock, and does not take account of your objectives, or your financial situation. We aim to bring you long-term focused analysis driven by fundamental data. Note that our analysis may not factor in the latest price-sensitive company announcements or qualitative material. Simply Wall St has no position in any stocks mentioned.
Companies discussed in this article include IBSE:YKBNKSASE:5110TSX:CSU
Have feedback on this article? Concerned about the content? Get in touch with us directly. Alternatively, email editorial-team@simplywallst.com
