
 Yahoo Finance
 Those who invested in Microchip Technology (NASDAQ:MCHP) five years ago are up 111%
When we invest, we're generally looking for stocks that outperform the market average. And while active stock picking involves risks (and requires diversification) it can also provide excess returns. To wit, the Microchip Technology share price has climbed 95% in five years, easily topping the market return of 75% (ignoring dividends). However, more recent returns haven't been as impressive as that, with the stock returning just 9.9% in the last year, including dividends.
So let's investigate and see if the longer term performance of the company has been in line with the underlying business' progress.
Check out our latest analysis for Microchip Technology
To paraphrase Benjamin Graham: Over the short term the market is a voting machine, but over the long term it's a weighing machine. One flawed but reasonable way to assess how sentiment around a company has changed is to compare the earnings per share (EPS) with the share price.
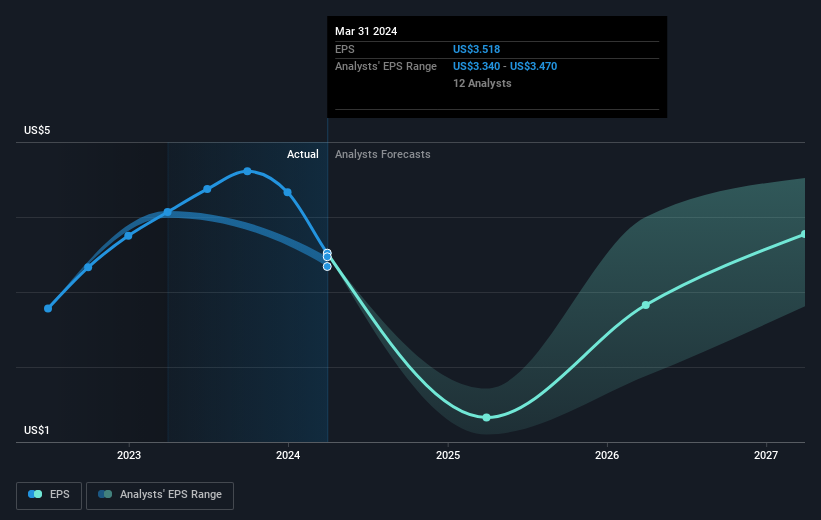
During five years of share price growth, Microchip Technology achieved compound earnings per share (EPS) growth of 36% per year. This EPS growth is higher than the 14% average annual increase in the share price. Therefore, it seems the market has become relatively pessimistic about the company.
The graphic below depicts how EPS has changed over time (unveil the exact values by clicking on the image).
It is of course excellent to see how Microchip Technology has grown profits over the years, but the future is more important for shareholders. Take a more thorough look at Microchip Technology's financial health with this free report on its balance sheet.
What About Dividends?
As well as measuring the share price return, investors should also consider the total shareholder return (TSR). The TSR is a return calculation that accounts for the value of cash dividends (assuming that any dividend received was reinvested) and the calculated value of any discounted capital raisings and spin-offs. Arguably, the TSR gives a more comprehensive picture of the return generated by a stock. We note that for Microchip Technology the TSR over the last 5 years was 111%, which is better than the share price return mentioned above. This is largely a result of its dividend payments!
A Different Perspective
Microchip Technology provided a TSR of 9.9% over the last twelve months. Unfortunately this falls short of the market return. If we look back over five years, the returns are even better, coming in at 16% per year for five years. It's quite possible the business continues to execute with prowess, even as the share price gains are slowing. It's always interesting to track share price performance over the longer term. But to understand Microchip Technology better, we need to consider many other factors. Take risks, for example - Microchip Technology has 2 warning signs we think you should be aware of.
Of course Microchip Technology may not be the best stock to buy. So you may wish to see this free collection of growth stocks.
Please note, the market returns quoted in this article reflect the market weighted average returns of stocks that currently trade on American exchanges.
Have feedback on this article? Concerned about the content? Get in touch with us directly. Alternatively, email editorial-team (at) simplywallst.com.
This article by Simply Wall St is general in nature. We provide commentary based on historical data and analyst forecasts only using an unbiased methodology and our articles are not intended to be financial advice. It does not constitute a recommendation to buy or sell any stock, and does not take account of your objectives, or your financial situation. We aim to bring you long-term focused analysis driven by fundamental data. Note that our analysis may not factor in the latest price-sensitive company announcements or qualitative material. Simply Wall St has no position in any stocks mentioned.
Have feedback on this article? Concerned about the content? Get in touch with us directly. Alternatively, email editorial-team@simplywallst.com
