
 Yahoo Finance
 Those who invested in Favelle Favco Berhad (KLSE:FAVCO) five years ago are up 25%
For many, the main point of investing is to generate higher returns than the overall market. But every investor is virtually certain to have both over-performing and under-performing stocks. At this point some shareholders may be questioning their investment in Favelle Favco Berhad (KLSE:FAVCO), since the last five years saw the share price fall 26%.
It's worthwhile assessing if the company's economics have been moving in lockstep with these underwhelming shareholder returns, or if there is some disparity between the two. So let's do just that.
See our latest analysis for Favelle Favco Berhad
While markets are a powerful pricing mechanism, share prices reflect investor sentiment, not just underlying business performance. One flawed but reasonable way to assess how sentiment around a company has changed is to compare the earnings per share (EPS) with the share price.
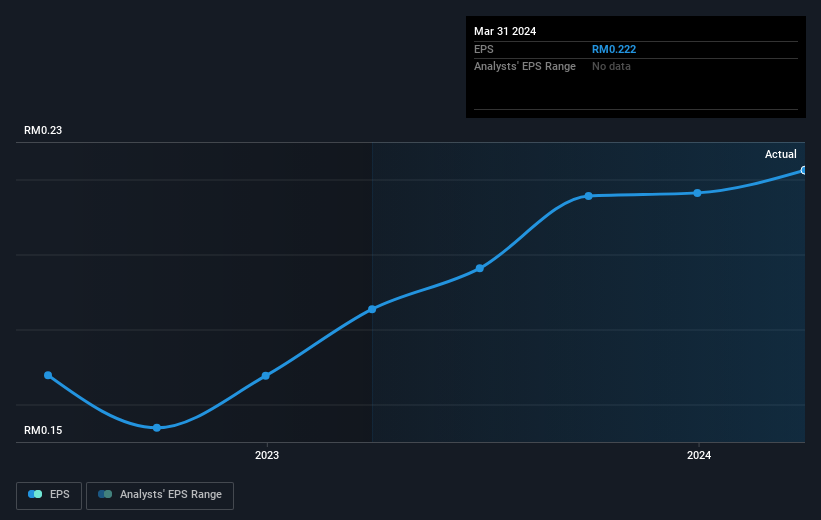
Looking back five years, both Favelle Favco Berhad's share price and EPS declined; the latter at a rate of 7.5% per year. This fall in the EPS is worse than the 6% compound annual share price fall. So investors might expect EPS to bounce back -- or they may have previously foreseen the EPS decline.
The image below shows how EPS has tracked over time (if you click on the image you can see greater detail).
Before buying or selling a stock, we always recommend a close examination of historic growth trends, available here.
What About Dividends?
As well as measuring the share price return, investors should also consider the total shareholder return (TSR). Whereas the share price return only reflects the change in the share price, the TSR includes the value of dividends (assuming they were reinvested) and the benefit of any discounted capital raising or spin-off. It's fair to say that the TSR gives a more complete picture for stocks that pay a dividend. We note that for Favelle Favco Berhad the TSR over the last 5 years was 25%, which is better than the share price return mentioned above. And there's no prize for guessing that the dividend payments largely explain the divergence!
A Different Perspective
Favelle Favco Berhad shareholders gained a total return of 20% during the year. Unfortunately this falls short of the market return. On the bright side, that's still a gain, and it's actually better than the average return of 5% over half a decade This suggests the company might be improving over time. It's always interesting to track share price performance over the longer term. But to understand Favelle Favco Berhad better, we need to consider many other factors. Take risks, for example - Favelle Favco Berhad has 2 warning signs (and 1 which is concerning) we think you should know about.
Of course, you might find a fantastic investment by looking elsewhere. So take a peek at this free list of companies we expect will grow earnings.
Please note, the market returns quoted in this article reflect the market weighted average returns of stocks that currently trade on Malaysian exchanges.
Have feedback on this article? Concerned about the content? Get in touch with us directly. Alternatively, email editorial-team (at) simplywallst.com.
This article by Simply Wall St is general in nature. We provide commentary based on historical data and analyst forecasts only using an unbiased methodology and our articles are not intended to be financial advice. It does not constitute a recommendation to buy or sell any stock, and does not take account of your objectives, or your financial situation. We aim to bring you long-term focused analysis driven by fundamental data. Note that our analysis may not factor in the latest price-sensitive company announcements or qualitative material. Simply Wall St has no position in any stocks mentioned.
Have feedback on this article? Concerned about the content? Get in touch with us directly. Alternatively, email editorial-team@simplywallst.com
