
 Yahoo Finance
 There's Been No Shortage Of Growth Recently For MRC Global's (NYSE:MRC) Returns On Capital
If we want to find a stock that could multiply over the long term, what are the underlying trends we should look for? One common approach is to try and find a company with returns on capital employed (ROCE) that are increasing, in conjunction with a growing amount of capital employed. If you see this, it typically means it's a company with a great business model and plenty of profitable reinvestment opportunities. Speaking of which, we noticed some great changes in MRC Global's (NYSE:MRC) returns on capital, so let's have a look.
Return On Capital Employed (ROCE): What Is It?
Just to clarify if you're unsure, ROCE is a metric for evaluating how much pre-tax income (in percentage terms) a company earns on the capital invested in its business. To calculate this metric for MRC Global, this is the formula:
Return on Capital Employed = Earnings Before Interest and Tax (EBIT) ÷ (Total Assets - Current Liabilities)
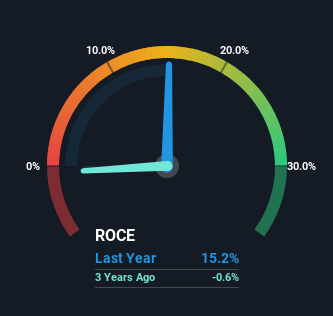
0.15 = US$168m ÷ (US$1.9b - US$814m) (Based on the trailing twelve months to March 2024).
So, MRC Global has an ROCE of 15%. On its own, that's a standard return, however it's much better than the 13% generated by the Trade Distributors industry.
View our latest analysis for MRC Global
In the above chart we have measured MRC Global's prior ROCE against its prior performance, but the future is arguably more important. If you'd like to see what analysts are forecasting going forward, you should check out our free analyst report for MRC Global .
What Does the ROCE Trend For MRC Global Tell Us?
MRC Global has not disappointed in regards to ROCE growth. We found that the returns on capital employed over the last five years have risen by 133%. That's not bad because this tells for every dollar invested (capital employed), the company is increasing the amount earned from that dollar. Interestingly, the business may be becoming more efficient because it's applying 47% less capital than it was five years ago. If this trend continues, the business might be getting more efficient but it's shrinking in terms of total assets.
For the record though, there was a noticeable increase in the company's current liabilities over the period, so we would attribute some of the ROCE growth to that. Essentially the business now has suppliers or short-term creditors funding about 42% of its operations, which isn't ideal. And with current liabilities at those levels, that's pretty high.
What We Can Learn From MRC Global's ROCE
From what we've seen above, MRC Global has managed to increase it's returns on capital all the while reducing it's capital base. Astute investors may have an opportunity here because the stock has declined 29% in the last five years. So researching this company further and determining whether or not these trends will continue seems justified.
MRC Global does have some risks though, and we've spotted 1 warning sign for MRC Global that you might be interested in.
If you want to search for solid companies with great earnings, check out this free list of companies with good balance sheets and impressive returns on equity.
Have feedback on this article? Concerned about the content? Get in touch with us directly. Alternatively, email editorial-team (at) simplywallst.com.
This article by Simply Wall St is general in nature. We provide commentary based on historical data and analyst forecasts only using an unbiased methodology and our articles are not intended to be financial advice. It does not constitute a recommendation to buy or sell any stock, and does not take account of your objectives, or your financial situation. We aim to bring you long-term focused analysis driven by fundamental data. Note that our analysis may not factor in the latest price-sensitive company announcements or qualitative material. Simply Wall St has no position in any stocks mentioned.
Have feedback on this article? Concerned about the content? Get in touch with us directly. Alternatively, email editorial-team@simplywallst.com
