
 Yahoo Finance
 Quantum Foods Holdings' (JSE:QFH) Returns On Capital Tell Us There Is Reason To Feel Uneasy
What financial metrics can indicate to us that a company is maturing or even in decline? Typically, we'll see the trend of both return on capital employed (ROCE) declining and this usually coincides with a decreasing amount of capital employed. This reveals that the company isn't compounding shareholder wealth because returns are falling and its net asset base is shrinking. So after glancing at the trends within Quantum Foods Holdings (JSE:QFH), we weren't too hopeful.
What Is Return On Capital Employed (ROCE)?
If you haven't worked with ROCE before, it measures the 'return' (pre-tax profit) a company generates from capital employed in its business. To calculate this metric for Quantum Foods Holdings, this is the formula:
Return on Capital Employed = Earnings Before Interest and Tax (EBIT) ÷ (Total Assets - Current Liabilities)
0.0053 = R13m ÷ (R3.0b - R609m) (Based on the trailing twelve months to March 2024).
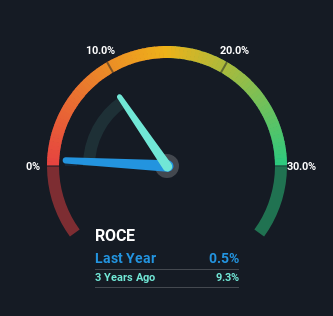
Thus, Quantum Foods Holdings has an ROCE of 0.5%. Ultimately, that's a low return and it under-performs the Food industry average of 8.0%.
Check out our latest analysis for Quantum Foods Holdings
While the past is not representative of the future, it can be helpful to know how a company has performed historically, which is why we have this chart above. If you'd like to look at how Quantum Foods Holdings has performed in the past in other metrics, you can view this free graph of Quantum Foods Holdings' past earnings, revenue and cash flow.
What Does the ROCE Trend For Quantum Foods Holdings Tell Us?
We are a bit worried about the trend of returns on capital at Quantum Foods Holdings. To be more specific, the ROCE was 16% five years ago, but since then it has dropped noticeably. And on the capital employed front, the business is utilizing roughly the same amount of capital as it was back then. Companies that exhibit these attributes tend to not be shrinking, but they can be mature and facing pressure on their margins from competition. So because these trends aren't typically conducive to creating a multi-bagger, we wouldn't hold our breath on Quantum Foods Holdings becoming one if things continue as they have.
The Bottom Line
All in all, the lower returns from the same amount of capital employed aren't exactly signs of a compounding machine. Yet despite these poor fundamentals, the stock has gained a huge 319% over the last five years, so investors appear very optimistic. Regardless, we don't feel too comfortable with the fundamentals so we'd be steering clear of this stock for now.
One final note, you should learn about the 3 warning signs we've spotted with Quantum Foods Holdings (including 2 which are significant) .
While Quantum Foods Holdings isn't earning the highest return, check out this free list of companies that are earning high returns on equity with solid balance sheets.
Have feedback on this article? Concerned about the content? Get in touch with us directly. Alternatively, email editorial-team (at) simplywallst.com.
This article by Simply Wall St is general in nature. We provide commentary based on historical data and analyst forecasts only using an unbiased methodology and our articles are not intended to be financial advice. It does not constitute a recommendation to buy or sell any stock, and does not take account of your objectives, or your financial situation. We aim to bring you long-term focused analysis driven by fundamental data. Note that our analysis may not factor in the latest price-sensitive company announcements or qualitative material. Simply Wall St has no position in any stocks mentioned.
Have feedback on this article? Concerned about the content? Get in touch with us directly. Alternatively, email editorial-team@simplywallst.com
