
 Yahoo Finance
 Northrop Grumman (NYSE:NOC) Has Some Difficulty Using Its Capital Effectively
When it comes to investing, there are some useful financial metrics that can warn us when a business is potentially in trouble. When we see a declining return on capital employed (ROCE) in conjunction with a declining base of capital employed, that's often how a mature business shows signs of aging. This reveals that the company isn't compounding shareholder wealth because returns are falling and its net asset base is shrinking. And from a first read, things don't look too good at Northrop Grumman (NYSE:NOC), so let's see why.
Return On Capital Employed (ROCE): What Is It?
Just to clarify if you're unsure, ROCE is a metric for evaluating how much pre-tax income (in percentage terms) a company earns on the capital invested in its business. The formula for this calculation on Northrop Grumman is:
Return on Capital Employed = Earnings Before Interest and Tax (EBIT) ÷ (Total Assets - Current Liabilities)
0.081 = US$2.8b ÷ (US$48b - US$13b) (Based on the trailing twelve months to March 2024).
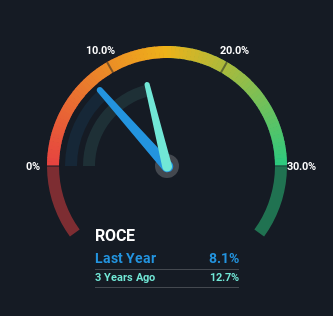
So, Northrop Grumman has an ROCE of 8.1%. On its own, that's a low figure but it's around the 9.8% average generated by the Aerospace & Defense industry.
Check out our latest analysis for Northrop Grumman
Above you can see how the current ROCE for Northrop Grumman compares to its prior returns on capital, but there's only so much you can tell from the past. If you'd like to see what analysts are forecasting going forward, you should check out our free analyst report for Northrop Grumman .
So How Is Northrop Grumman's ROCE Trending?
In terms of Northrop Grumman's historical ROCE movements, the trend doesn't inspire confidence. About five years ago, returns on capital were 14%, however they're now substantially lower than that as we saw above. On top of that, it's worth noting that the amount of capital employed within the business has remained relatively steady. Since returns are falling and the business has the same amount of assets employed, this can suggest it's a mature business that hasn't had much growth in the last five years. If these trends continue, we wouldn't expect Northrop Grumman to turn into a multi-bagger.
Our Take On Northrop Grumman's ROCE
In summary, it's unfortunate that Northrop Grumman is generating lower returns from the same amount of capital. But investors must be expecting an improvement of sorts because over the last five yearsthe stock has delivered a respectable 45% return. In any case, the current underlying trends don't bode well for long term performance so unless they reverse, we'd start looking elsewhere.
One more thing, we've spotted 2 warning signs facing Northrop Grumman that you might find interesting.
For those who like to invest in solid companies, check out this free list of companies with solid balance sheets and high returns on equity.
Have feedback on this article? Concerned about the content? Get in touch with us directly. Alternatively, email editorial-team (at) simplywallst.com.
This article by Simply Wall St is general in nature. We provide commentary based on historical data and analyst forecasts only using an unbiased methodology and our articles are not intended to be financial advice. It does not constitute a recommendation to buy or sell any stock, and does not take account of your objectives, or your financial situation. We aim to bring you long-term focused analysis driven by fundamental data. Note that our analysis may not factor in the latest price-sensitive company announcements or qualitative material. Simply Wall St has no position in any stocks mentioned.
Have feedback on this article? Concerned about the content? Get in touch with us directly. Alternatively, email editorial-team@simplywallst.com
