
 Yahoo Finance
 Johnson & Johnson (NYSE:JNJ) Seems To Use Debt Quite Sensibly
Legendary fund manager Li Lu (who Charlie Munger backed) once said, 'The biggest investment risk is not the volatility of prices, but whether you will suffer a permanent loss of capital.' So it might be obvious that you need to consider debt, when you think about how risky any given stock is, because too much debt can sink a company. We note that Johnson & Johnson (NYSE:JNJ) does have debt on its balance sheet. But the real question is whether this debt is making the company risky.
What Risk Does Debt Bring?
Generally speaking, debt only becomes a real problem when a company can't easily pay it off, either by raising capital or with its own cash flow. Part and parcel of capitalism is the process of 'creative destruction' where failed businesses are mercilessly liquidated by their bankers. However, a more usual (but still expensive) situation is where a company must dilute shareholders at a cheap share price simply to get debt under control. Of course, debt can be an important tool in businesses, particularly capital heavy businesses. The first step when considering a company's debt levels is to consider its cash and debt together.
View our latest analysis for Johnson & Johnson
What Is Johnson & Johnson's Debt?
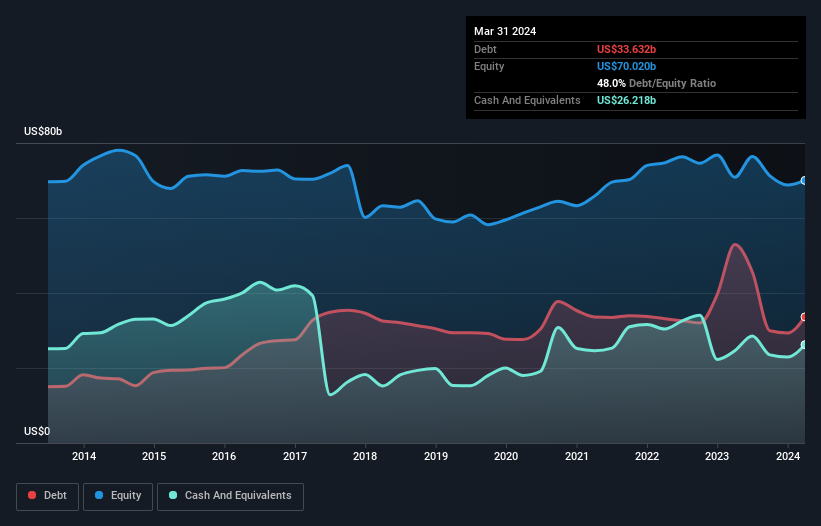
The image below, which you can click on for greater detail, shows that Johnson & Johnson had debt of US$33.6b at the end of March 2024, a reduction from US$52.9b over a year. However, it also had US$26.2b in cash, and so its net debt is US$7.41b.
A Look At Johnson & Johnson's Liabilities
Zooming in on the latest balance sheet data, we can see that Johnson & Johnson had liabilities of US$48.7b due within 12 months and liabilities of US$53.2b due beyond that. Offsetting this, it had US$26.2b in cash and US$14.9b in receivables that were due within 12 months. So its liabilities outweigh the sum of its cash and (near-term) receivables by US$60.8b.
Of course, Johnson & Johnson has a titanic market capitalization of US$358.0b, so these liabilities are probably manageable. Having said that, it's clear that we should continue to monitor its balance sheet, lest it change for the worse.
We use two main ratios to inform us about debt levels relative to earnings. The first is net debt divided by earnings before interest, tax, depreciation, and amortization (EBITDA), while the second is how many times its earnings before interest and tax (EBIT) covers its interest expense (or its interest cover, for short). The advantage of this approach is that we take into account both the absolute quantum of debt (with net debt to EBITDA) and the actual interest expenses associated with that debt (with its interest cover ratio).
Johnson & Johnson has a low debt to EBITDA ratio of only 0.24. And remarkably, despite having net debt, it actually received more in interest over the last twelve months than it had to pay. So there's no doubt this company can take on debt while staying cool as a cucumber. Fortunately, Johnson & Johnson grew its EBIT by 7.8% in the last year, making that debt load look even more manageable. There's no doubt that we learn most about debt from the balance sheet. But it is future earnings, more than anything, that will determine Johnson & Johnson's ability to maintain a healthy balance sheet going forward. So if you're focused on the future you can check out this free report showing analyst profit forecasts.
Finally, a company can only pay off debt with cold hard cash, not accounting profits. So we always check how much of that EBIT is translated into free cash flow. Over the most recent three years, Johnson & Johnson recorded free cash flow worth 77% of its EBIT, which is around normal, given free cash flow excludes interest and tax. This cold hard cash means it can reduce its debt when it wants to.
Our View
Johnson & Johnson's interest cover suggests it can handle its debt as easily as Cristiano Ronaldo could score a goal against an under 14's goalkeeper. And that's just the beginning of the good news since its conversion of EBIT to free cash flow is also very heartening. Looking at the bigger picture, we think Johnson & Johnson's use of debt seems quite reasonable and we're not concerned about it. After all, sensible leverage can boost returns on equity. When analysing debt levels, the balance sheet is the obvious place to start. But ultimately, every company can contain risks that exist outside of the balance sheet. For example, we've discovered 2 warning signs for Johnson & Johnson (1 doesn't sit too well with us!) that you should be aware of before investing here.
When all is said and done, sometimes its easier to focus on companies that don't even need debt. Readers can access a list of growth stocks with zero net debt 100% free, right now.
Have feedback on this article? Concerned about the content? Get in touch with us directly. Alternatively, email editorial-team (at) simplywallst.com.
This article by Simply Wall St is general in nature. We provide commentary based on historical data and analyst forecasts only using an unbiased methodology and our articles are not intended to be financial advice. It does not constitute a recommendation to buy or sell any stock, and does not take account of your objectives, or your financial situation. We aim to bring you long-term focused analysis driven by fundamental data. Note that our analysis may not factor in the latest price-sensitive company announcements or qualitative material. Simply Wall St has no position in any stocks mentioned.
Have feedback on this article? Concerned about the content? Get in touch with us directly. Alternatively, email editorial-team@simplywallst.com
