
 Yahoo Finance
 Japanese Exchange Growth Leaders With High Insider Ownership June 2024
Amid a backdrop of heightened uncertainty regarding the Bank of Japan's monetary policy and a modest downturn in the Nikkei 225 and TOPIX indices, investors may find solace in growth companies with high insider ownership. Such stocks often reflect a commitment from those who know the company best, potentially offering stability as they navigate through Japan's current economic climate.
Top 10 Growth Companies With High Insider Ownership In Japan
Name | Insider Ownership | Earnings Growth |
SHIFT (TSE:3697) | 35.4% | 26.8% |
Kanamic NetworkLTD (TSE:3939) | 25% | 28.9% |
Hottolink (TSE:3680) | 27% | 57.3% |
Medley (TSE:4480) | 34% | 28.7% |
Micronics Japan (TSE:6871) | 15.3% | 39.8% |
Kasumigaseki CapitalLtd (TSE:3498) | 34.8% | 44.6% |
ExaWizards (TSE:4259) | 24.8% | 91.1% |
Soiken Holdings (TSE:2385) | 19.8% | 118.4% |
AeroEdge (TSE:7409) | 10.7% | 28.5% |
freee K.K (TSE:4478) | 24% | 81% |
Here's a peek at a few of the choices from the screener.
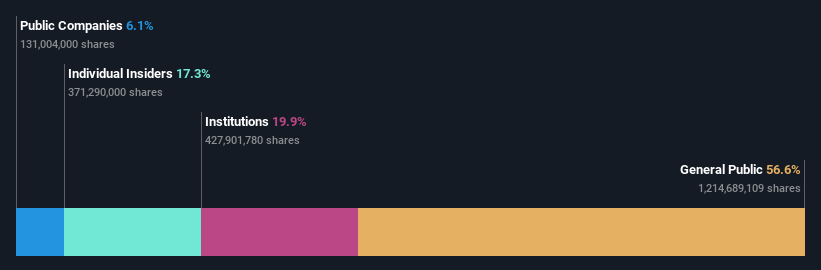
Rakuten Group
Simply Wall St Growth Rating: ★★★★☆☆
Overview: Rakuten Group, Inc. operates in e-commerce, fintech, digital content, and communications sectors globally with a market capitalization of approximately ¥1.82 trillion.
Operations: The company generates revenue through its operations in online retail, financial services, digital media, and telecommunications.
Insider Ownership: 17.3%
Earnings Growth Forecast: 83.9% p.a.
Rakuten Group is trading at a significant discount, priced 77.5% below its estimated fair value, signaling potential for investors seeking undervalued growth opportunities in Japan. Despite a low forecasted Return on Equity of 9.1% in three years, the company's earnings are expected to surge by 83.88% annually. Recently, Rakuten confirmed expectations for double-digit growth in its 2024 operating results and successfully raised US$1.99 billion through a high-yield fixed income offering, enhancing its financial flexibility amidst plans to potentially abort the listing of its securities unit.
Click to explore a detailed breakdown of our findings in Rakuten Group's earnings growth report.
Our valuation report here indicates Rakuten Group may be undervalued.
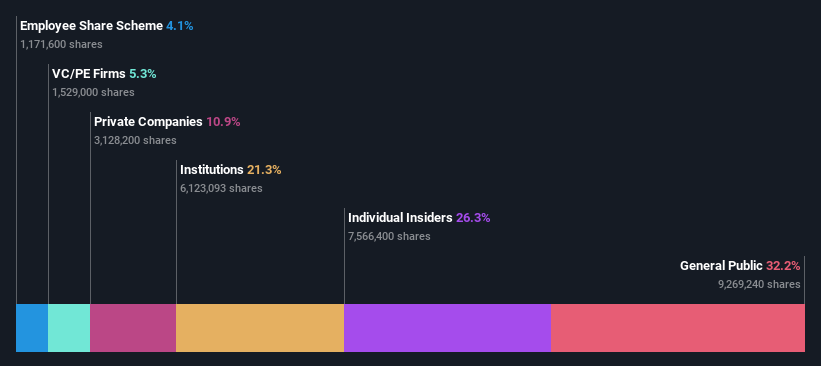
Mimaki Engineering
Simply Wall St Growth Rating: ★★★★☆☆
Overview: Mimaki Engineering Co., Ltd. is a company that develops, manufactures, and sells computer devices and software both in Japan and internationally, with a market capitalization of ¥54.11 billion.
Operations: Mimaki Engineering generates revenue across various global regions, with ¥62.31 billion from Japan/Asia/Oceania, ¥21.49 billion from North/Latin America, and ¥24.29 billion from Europe/Middle East/Africa.
Insider Ownership: 26.3%
Earnings Growth Forecast: 20.2% p.a.
Mimaki Engineering, with high insider ownership, reflects a mixed growth outlook in Japan's market. While its earnings are set to grow by 20.23% annually, surpassing the Japanese market average, revenue growth at 8.5% yearly is modest but still above the local market trend. The company's share price has been highly volatile recently. Additionally, Mimaki plans to increase dividends and forecasts robust financial performance for FY2025 with expected net sales reaching JPY 80.80 billion and operating profit at JPY 6.50 billion.
Micronics Japan
Simply Wall St Growth Rating: ★★★★★★
Overview: Micronics Japan Co., Ltd. operates globally, developing, manufacturing, and selling testing and measurement equipment for semiconductors and LCD systems, with a market capitalization of approximately ¥252.70 billion.
Operations: The company generates revenue primarily through the development, manufacture, and sale of semiconductor and LCD testing and measurement equipment.
Insider Ownership: 15.3%
Earnings Growth Forecast: 39.8% p.a.
Micronics Japan, trading significantly below its estimated fair value, is poised for robust growth with revenue expected to increase by 23.2% annually, outpacing the Japanese market's 4.2%. Despite a decrease in profit margins from 16.7% to 10.6%, earnings are projected to surge by 39.78% yearly, far exceeding the market average of 9%. This growth potential is underscored by a high forecasted Return on Equity of 26.8%, although recent share price volatility and lack of recent insider transactions add elements of caution.

Turning Ideas Into Actions
Embark on your investment journey to our 99 Fast Growing Japanese Companies With High Insider Ownership selection here.
Have you diversified into these companies? Leverage the power of Simply Wall St's portfolio to keep a close eye on market movements affecting your investments.
Discover a world of investment opportunities with Simply Wall St's free app and access unparalleled stock analysis across all markets.
Want To Explore Some Alternatives?
Explore high-performing small cap companies that haven't yet garnered significant analyst attention.
Diversify your portfolio with solid dividend payers offering reliable income streams to weather potential market turbulence.
Find companies with promising cash flow potential yet trading below their fair value.
This article by Simply Wall St is general in nature. We provide commentary based on historical data and analyst forecasts only using an unbiased methodology and our articles are not intended to be financial advice. It does not constitute a recommendation to buy or sell any stock, and does not take account of your objectives, or your financial situation. We aim to bring you long-term focused analysis driven by fundamental data. Note that our analysis may not factor in the latest price-sensitive company announcements or qualitative material. Simply Wall St has no position in any stocks mentioned.The analysis only considers stock directly held by insiders. It does not include indirectly owned stock through other vehicles such as corporate and/or trust entities. All forecast revenue and earnings growth rates quoted are in terms of annualised (per annum) growth rates over 1-3 years.
Companies discussed in this article include TSE:4755TSE:6638 and TSE:6871.
Have feedback on this article? Concerned about the content? Get in touch with us directly. Alternatively, email editorial-team@simplywallst.com
