
 Yahoo Finance
 Investors Still Waiting For A Pull Back In DuPont de Nemours, Inc. (NYSE:DD)
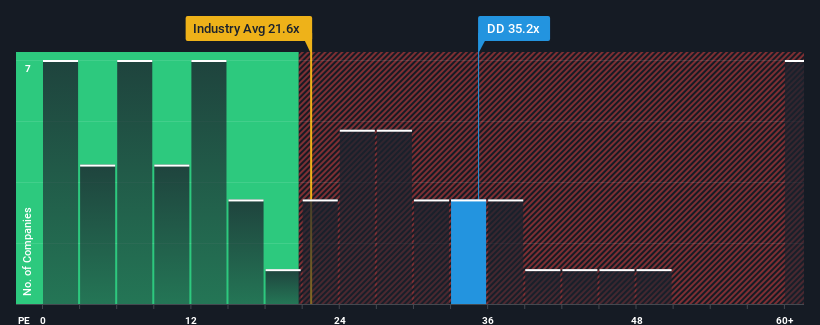
When close to half the companies in the United States have price-to-earnings ratios (or "P/E's") below 16x, you may consider DuPont de Nemours, Inc. (NYSE:DD) as a stock to avoid entirely with its 35.2x P/E ratio. Although, it's not wise to just take the P/E at face value as there may be an explanation why it's so lofty.
Recent times haven't been advantageous for DuPont de Nemours as its earnings have been falling quicker than most other companies. It might be that many expect the dismal earnings performance to recover substantially, which has kept the P/E from collapsing. If not, then existing shareholders may be very nervous about the viability of the share price.
Check out our latest analysis for DuPont de Nemours
Keen to find out how analysts think DuPont de Nemours' future stacks up against the industry? In that case, our free report is a great place to start.
How Is DuPont de Nemours' Growth Trending?
DuPont de Nemours' P/E ratio would be typical for a company that's expected to deliver very strong growth, and importantly, perform much better than the market.
If we review the last year of earnings, dishearteningly the company's profits fell to the tune of 7.4%. Unfortunately, that's brought it right back to where it started three years ago with EPS growth being virtually non-existent overall during that time. Therefore, it's fair to say that earnings growth has been inconsistent recently for the company.
Shifting to the future, estimates from the analysts covering the company suggest earnings should grow by 31% per annum over the next three years. Meanwhile, the rest of the market is forecast to only expand by 12% per year, which is noticeably less attractive.
With this information, we can see why DuPont de Nemours is trading at such a high P/E compared to the market. It seems most investors are expecting this strong future growth and are willing to pay more for the stock.
The Bottom Line On DuPont de Nemours' P/E
Using the price-to-earnings ratio alone to determine if you should sell your stock isn't sensible, however it can be a practical guide to the company's future prospects.
As we suspected, our examination of DuPont de Nemours' analyst forecasts revealed that its superior earnings outlook is contributing to its high P/E. Right now shareholders are comfortable with the P/E as they are quite confident future earnings aren't under threat. It's hard to see the share price falling strongly in the near future under these circumstances.
We don't want to rain on the parade too much, but we did also find 1 warning sign for DuPont de Nemours that you need to be mindful of.
It's important to make sure you look for a great company, not just the first idea you come across. So take a peek at this free list of interesting companies with strong recent earnings growth (and a low P/E).
Have feedback on this article? Concerned about the content? Get in touch with us directly. Alternatively, email editorial-team (at) simplywallst.com.
This article by Simply Wall St is general in nature. We provide commentary based on historical data and analyst forecasts only using an unbiased methodology and our articles are not intended to be financial advice. It does not constitute a recommendation to buy or sell any stock, and does not take account of your objectives, or your financial situation. We aim to bring you long-term focused analysis driven by fundamental data. Note that our analysis may not factor in the latest price-sensitive company announcements or qualitative material. Simply Wall St has no position in any stocks mentioned.
