
 Yahoo Finance
 Some Investors May Be Worried About Hays' (LON:HAS) Returns On Capital
What underlying fundamental trends can indicate that a company might be in decline? More often than not, we'll see a declining return on capital employed (ROCE) and a declining amount of capital employed. Basically the company is earning less on its investments and it is also reducing its total assets. In light of that, from a first glance at Hays (LON:HAS), we've spotted some signs that it could be struggling, so let's investigate.
Return On Capital Employed (ROCE): What Is It?
Just to clarify if you're unsure, ROCE is a metric for evaluating how much pre-tax income (in percentage terms) a company earns on the capital invested in its business. Analysts use this formula to calculate it for Hays:
Return on Capital Employed = Earnings Before Interest and Tax (EBIT) ÷ (Total Assets - Current Liabilities)
0.19 = UK£160m ÷ (UK£1.8b - UK£925m) (Based on the trailing twelve months to December 2023).
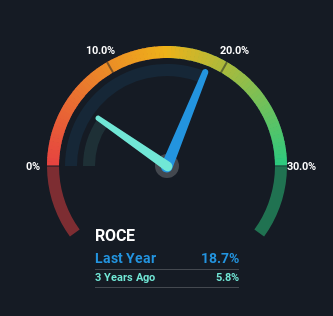
Therefore, Hays has an ROCE of 19%. By itself that's a normal return on capital and it's in line with the industry's average returns of 19%.
See our latest analysis for Hays
Above you can see how the current ROCE for Hays compares to its prior returns on capital, but there's only so much you can tell from the past. If you're interested, you can view the analysts predictions in our free analyst report for Hays .
What Can We Tell From Hays' ROCE Trend?
We are a bit worried about the trend of returns on capital at Hays. To be more specific, the ROCE was 34% five years ago, but since then it has dropped noticeably. And on the capital employed front, the business is utilizing roughly the same amount of capital as it was back then. Since returns are falling and the business has the same amount of assets employed, this can suggest it's a mature business that hasn't had much growth in the last five years. If these trends continue, we wouldn't expect Hays to turn into a multi-bagger.
On a side note, Hays' current liabilities are still rather high at 52% of total assets. This effectively means that suppliers (or short-term creditors) are funding a large portion of the business, so just be aware that this can introduce some elements of risk. While it's not necessarily a bad thing, it can be beneficial if this ratio is lower.
The Bottom Line
In summary, it's unfortunate that Hays is generating lower returns from the same amount of capital. It should come as no surprise then that the stock has fallen 18% over the last five years, so it looks like investors are recognizing these changes. With underlying trends that aren't great in these areas, we'd consider looking elsewhere.
Hays does have some risks though, and we've spotted 2 warning signs for Hays that you might be interested in.
If you want to search for solid companies with great earnings, check out this free list of companies with good balance sheets and impressive returns on equity.
Have feedback on this article? Concerned about the content? Get in touch with us directly. Alternatively, email editorial-team (at) simplywallst.com.
This article by Simply Wall St is general in nature. We provide commentary based on historical data and analyst forecasts only using an unbiased methodology and our articles are not intended to be financial advice. It does not constitute a recommendation to buy or sell any stock, and does not take account of your objectives, or your financial situation. We aim to bring you long-term focused analysis driven by fundamental data. Note that our analysis may not factor in the latest price-sensitive company announcements or qualitative material. Simply Wall St has no position in any stocks mentioned.
Have feedback on this article? Concerned about the content? Get in touch with us directly. Alternatively, email editorial-team@simplywallst.com
