
 Yahoo Finance
 Investors in Aquis Exchange (LON:AQX) have unfortunately lost 32% over the last three years
It is doubtless a positive to see that the Aquis Exchange PLC (LON:AQX) share price has gained some 35% in the last three months. But that cannot eclipse the less-than-impressive returns over the last three years. In fact, the share price is down 32% in the last three years, falling well short of the market return.
It's worthwhile assessing if the company's economics have been moving in lockstep with these underwhelming shareholder returns, or if there is some disparity between the two. So let's do just that.
Check out our latest analysis for Aquis Exchange
To paraphrase Benjamin Graham: Over the short term the market is a voting machine, but over the long term it's a weighing machine. One imperfect but simple way to consider how the market perception of a company has shifted is to compare the change in the earnings per share (EPS) with the share price movement.
During the unfortunate three years of share price decline, Aquis Exchange actually saw its earnings per share (EPS) improve by 76% per year. This is quite a puzzle, and suggests there might be something temporarily buoying the share price. Or else the company was over-hyped in the past, and so its growth has disappointed.
Since the change in EPS doesn't seem to correlate with the change in share price, it's worth taking a look at other metrics.
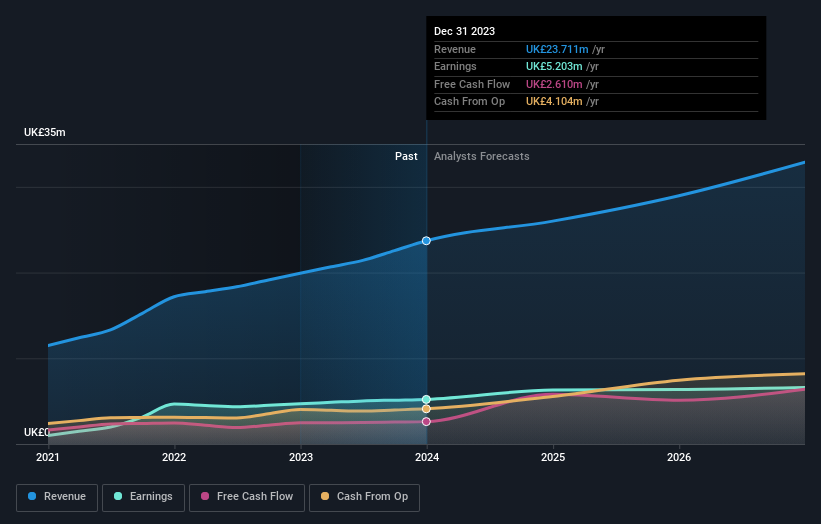
Revenue is actually up 22% over the three years, so the share price drop doesn't seem to hinge on revenue, either. It's probably worth investigating Aquis Exchange further; while we may be missing something on this analysis, there might also be an opportunity.
The graphic below depicts how earnings and revenue have changed over time (unveil the exact values by clicking on the image).
It is of course excellent to see how Aquis Exchange has grown profits over the years, but the future is more important for shareholders. Take a more thorough look at Aquis Exchange's financial health with this free report on its balance sheet.
A Different Perspective
It's nice to see that Aquis Exchange shareholders have received a total shareholder return of 17% over the last year. Notably the five-year annualised TSR loss of 0.4% per year compares very unfavourably with the recent share price performance. This makes us a little wary, but the business might have turned around its fortunes. I find it very interesting to look at share price over the long term as a proxy for business performance. But to truly gain insight, we need to consider other information, too. Even so, be aware that Aquis Exchange is showing 1 warning sign in our investment analysis , you should know about...
If you like to buy stocks alongside management, then you might just love this free list of companies. (Hint: many of them are unnoticed AND have attractive valuation).
Please note, the market returns quoted in this article reflect the market weighted average returns of stocks that currently trade on British exchanges.
Have feedback on this article? Concerned about the content? Get in touch with us directly. Alternatively, email editorial-team (at) simplywallst.com.
This article by Simply Wall St is general in nature. We provide commentary based on historical data and analyst forecasts only using an unbiased methodology and our articles are not intended to be financial advice. It does not constitute a recommendation to buy or sell any stock, and does not take account of your objectives, or your financial situation. We aim to bring you long-term focused analysis driven by fundamental data. Note that our analysis may not factor in the latest price-sensitive company announcements or qualitative material. Simply Wall St has no position in any stocks mentioned.
