
 Yahoo Finance
 Copa Holdings (NYSE:CPA) shareholders have earned a 9.9% CAGR over the last three years
By buying an index fund, you can roughly match the market return with ease. But if you buy good businesses at attractive prices, your portfolio returns could exceed the average market return. For example, the Copa Holdings, S.A. (NYSE:CPA) share price is up 24% in the last three years, clearly besting the market return of around 13% (not including dividends).
Now it's worth having a look at the company's fundamentals too, because that will help us determine if the long term shareholder return has matched the performance of the underlying business.
View our latest analysis for Copa Holdings
To paraphrase Benjamin Graham: Over the short term the market is a voting machine, but over the long term it's a weighing machine. One flawed but reasonable way to assess how sentiment around a company has changed is to compare the earnings per share (EPS) with the share price.
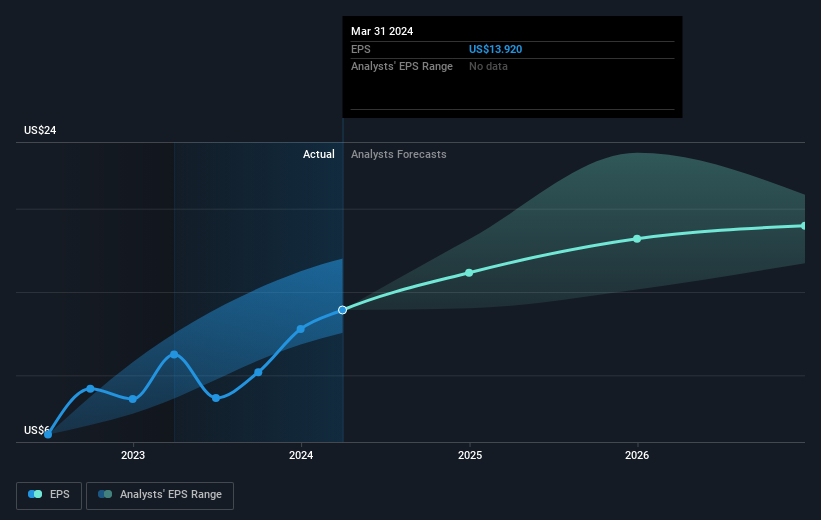
Copa Holdings became profitable within the last three years. So we would expect a higher share price over the period.
The image below shows how EPS has tracked over time (if you click on the image you can see greater detail).
It is of course excellent to see how Copa Holdings has grown profits over the years, but the future is more important for shareholders. This free interactive report on Copa Holdings' balance sheet strength is a great place to start, if you want to investigate the stock further.
What About Dividends?
As well as measuring the share price return, investors should also consider the total shareholder return (TSR). The TSR is a return calculation that accounts for the value of cash dividends (assuming that any dividend received was reinvested) and the calculated value of any discounted capital raisings and spin-offs. Arguably, the TSR gives a more comprehensive picture of the return generated by a stock. We note that for Copa Holdings the TSR over the last 3 years was 33%, which is better than the share price return mentioned above. This is largely a result of its dividend payments!
A Different Perspective
Copa Holdings shareholders are down 9.7% for the year (even including dividends), but the market itself is up 24%. However, keep in mind that even the best stocks will sometimes underperform the market over a twelve month period. Longer term investors wouldn't be so upset, since they would have made 1.5%, each year, over five years. If the fundamental data continues to indicate long term sustainable growth, the current sell-off could be an opportunity worth considering. It's always interesting to track share price performance over the longer term. But to understand Copa Holdings better, we need to consider many other factors. For example, we've discovered 2 warning signs for Copa Holdings that you should be aware of before investing here.
But note: Copa Holdings may not be the best stock to buy. So take a peek at this free list of interesting companies with past earnings growth (and further growth forecast).
Please note, the market returns quoted in this article reflect the market weighted average returns of stocks that currently trade on American exchanges.
Have feedback on this article? Concerned about the content? Get in touch with us directly. Alternatively, email editorial-team (at) simplywallst.com.
This article by Simply Wall St is general in nature. We provide commentary based on historical data and analyst forecasts only using an unbiased methodology and our articles are not intended to be financial advice. It does not constitute a recommendation to buy or sell any stock, and does not take account of your objectives, or your financial situation. We aim to bring you long-term focused analysis driven by fundamental data. Note that our analysis may not factor in the latest price-sensitive company announcements or qualitative material. Simply Wall St has no position in any stocks mentioned.
Have feedback on this article? Concerned about the content? Get in touch with us directly. Alternatively, email editorial-team@simplywallst.com
