
 Yahoo Finance
 Clariant AG's Dividend Analysis
Exploring the Sustainability and Growth of Clariant AG's Dividends
Clariant AG (CLZNF) recently announced a dividend of $0.42 per share, payable on 2024-06-03, with the ex-dividend date set for 2024-05-30. As investors look forward to this upcoming payment, the spotlight also shines on the company's dividend history, yield, and growth rates. Using the data from GuruFocus, let's look into Clariant AG's dividend performance and assess its sustainability.
What Does Clariant AG Do?
This Powerful Chart Made Peter Lynch 29% A Year For 13 Years
How to calculate the intrinsic value of a stock?
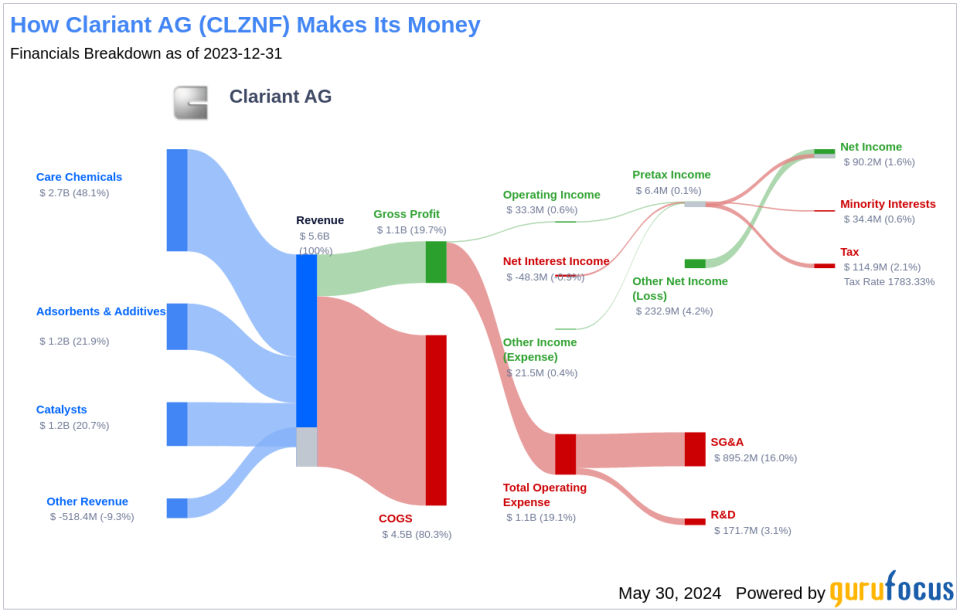
Clariant is a Switzerland-based specialty chemicals company with global operations. The company reports in three business areas: care chemicals, absorbents and additives, and catalysts. Care chemicals mainly targets consumer end markets such as personal care and homecare, but it also has an industrial component. Absorbents and additives encompass Clariant's coatings and adhesives, absorbents, and plastics segments. Catalysts manufacturers process catalysts, mainly for petrochemical and syngas plants.
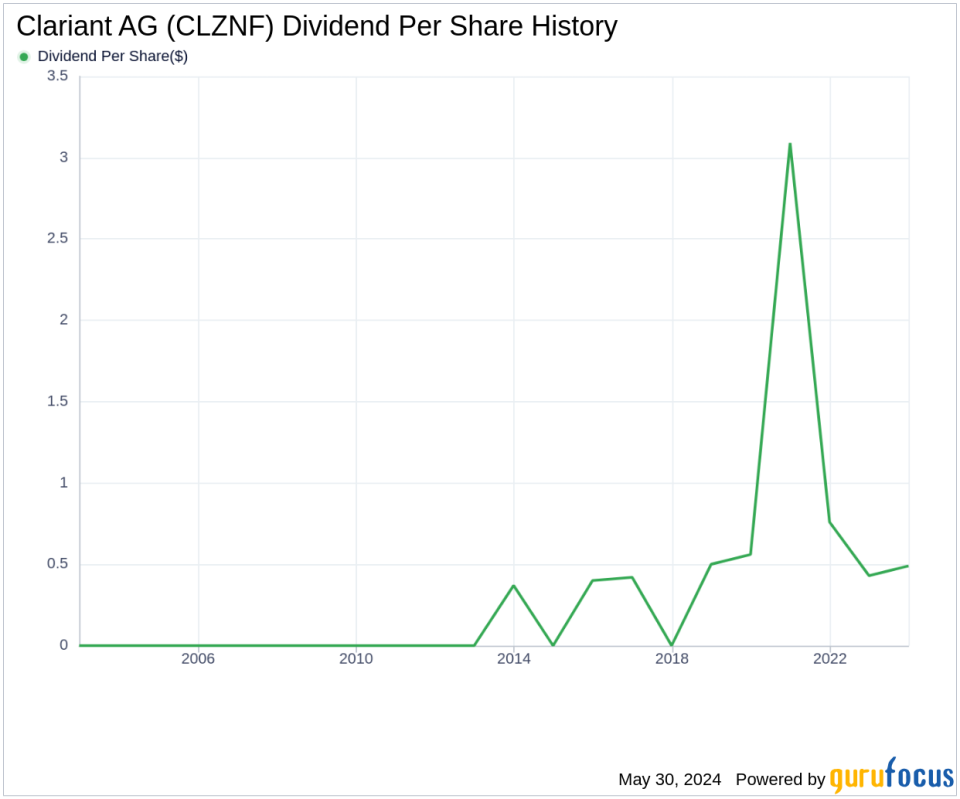
A Glimpse at Clariant AG's Dividend History
Clariant AG has maintained a consistent dividend payment record since 2018. Dividends are currently distributed on a yearly basis. Below is a chart showing annual Dividends Per Share for tracking historical trends.
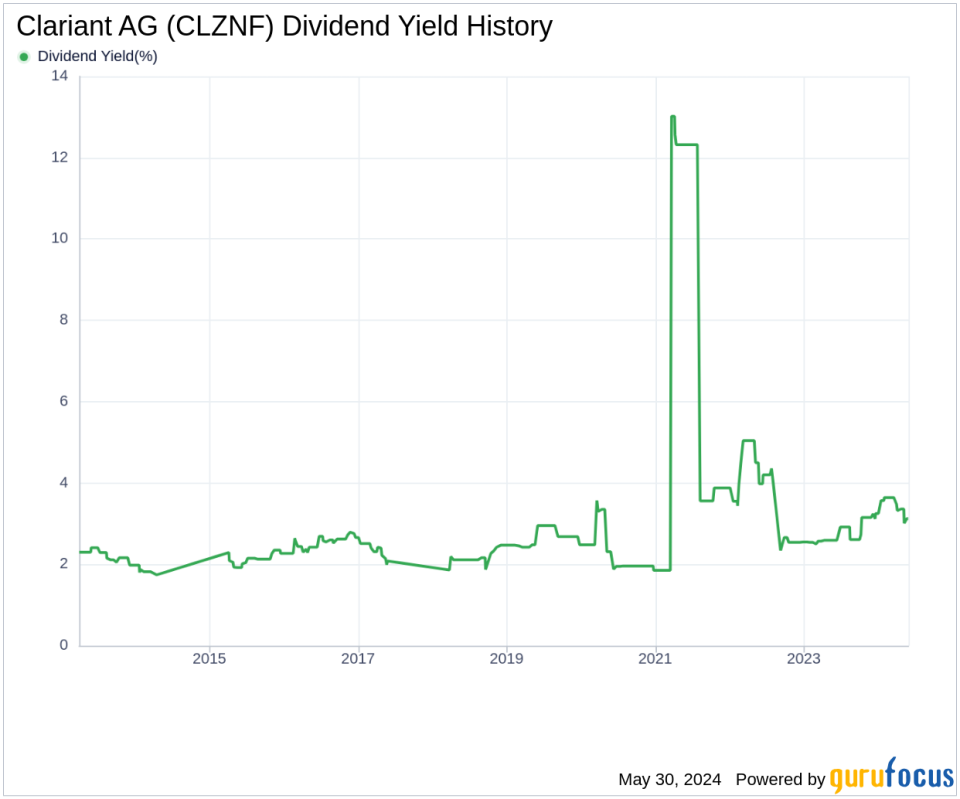
Breaking Down Clariant AG's Dividend Yield and Growth
As of today, Clariant AG currently has a 12-month trailing dividend yield of 3.08% and a 12-month forward dividend yield of 3.18%. This suggests an expectation of increased dividend payments over the next 12 months.
Over the past three years, Clariant AG's annual dividend growth rate was -46.50%. Extended to a five-year horizon, this rate increased to -8.70% per year. And over the past decade, Clariant AG's annual dividends per share growth rate stands at 6.90%.
Based on Clariant AG's dividend yield and five-year growth rate, the 5-year yield on cost of Clariant AG stock as of today is approximately 1.95%.
The Sustainability Question: Payout Ratio and Profitability
To assess the sustainability of the dividend, one needs to evaluate the company's payout ratio. The dividend payout ratio provides insights into the portion of earnings the company distributes as dividends. A lower ratio suggests that the company retains a significant part of its earnings, thereby ensuring the availability of funds for future growth and unexpected downturns. As of 2023-12-31, Clariant AG's dividend payout ratio is 0.83, which may suggest that the company's dividend may not be sustainable.
Clariant AG's profitability rank, offers an understanding of the company's earnings prowess relative to its peers. GuruFocus ranks Clariant AG's profitability 7 out of 10 as of 2023-12-31, suggesting good profitability prospects. The company has reported positive net income for each of year over the past decade, further solidifying its high profitability.
Growth Metrics: The Future Outlook
To ensure the sustainability of dividends, a company must have robust growth metrics. Clariant AG's growth rank of 7 out of 10 suggests that the company's growth trajectory is good relative to its competitors.
Revenue is the lifeblood of any company, and Clariant AG's revenue per share, combined with the 3-year revenue growth rate, indicates a strong revenue model. Clariant AG's revenue has increased by approximately 4.30% per year on average, a rate that underperforms approximately 63.72% of global competitors.
The company's 3-year EPS growth rate showcases its capability to grow its earnings, a critical component for sustaining dividends in the long run. During the past three years, Clariant AG's earnings increased by approximately 19.60% per year on average, a rate that underperforms approximately 29.94% of global competitors.
Conclusion
Considering Clariant AG's dividend payments, growth rates, payout ratio, profitability, and growth metrics, the company presents a mixed picture. While there are strong indicators of profitability and a stable dividend history, the negative growth rates in dividends over the past years raise concerns about future sustainability. Investors should weigh these factors carefully, especially those looking for long-term dividend growth. For more detailed analysis and screening tools, GuruFocus Premium users can utilize the High Dividend Yield Screener to find potentially better opportunities.
This article, generated by GuruFocus, is designed to provide general insights and is not tailored financial advice. Our commentary is rooted in historical data and analyst projections, utilizing an impartial methodology, and is not intended to serve as specific investment guidance. It does not formulate a recommendation to purchase or divest any stock and does not consider individual investment objectives or financial circumstances. Our objective is to deliver long-term, fundamental data-driven analysis. Be aware that our analysis might not incorporate the most recent, price-sensitive company announcements or qualitative information. GuruFocus holds no position in the stocks mentioned herein.
This article first appeared on GuruFocus.
