
 Yahoo Finance
 Capital Investments At Inta Bina Group Berhad (KLSE:INTA) Point To A Promising Future
If we want to find a potential multi-bagger, often there are underlying trends that can provide clues. In a perfect world, we'd like to see a company investing more capital into its business and ideally the returns earned from that capital are also increasing. If you see this, it typically means it's a company with a great business model and plenty of profitable reinvestment opportunities. Ergo, when we looked at the ROCE trends at Inta Bina Group Berhad (KLSE:INTA), we liked what we saw.
Understanding Return On Capital Employed (ROCE)
If you haven't worked with ROCE before, it measures the 'return' (pre-tax profit) a company generates from capital employed in its business. Analysts use this formula to calculate it for Inta Bina Group Berhad:
Return on Capital Employed = Earnings Before Interest and Tax (EBIT) ÷ (Total Assets - Current Liabilities)
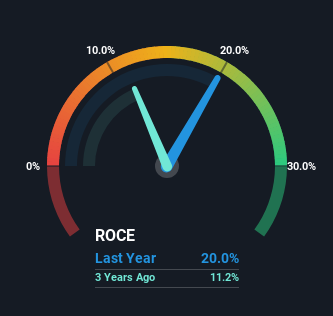
0.20 = RM37m ÷ (RM474m - RM289m) (Based on the trailing twelve months to March 2024).
Thus, Inta Bina Group Berhad has an ROCE of 20%. In absolute terms that's a great return and it's even better than the Construction industry average of 7.7%.
See our latest analysis for Inta Bina Group Berhad
Above you can see how the current ROCE for Inta Bina Group Berhad compares to its prior returns on capital, but there's only so much you can tell from the past. If you'd like to see what analysts are forecasting going forward, you should check out our free analyst report for Inta Bina Group Berhad .
The Trend Of ROCE
In terms of Inta Bina Group Berhad's history of ROCE, it's quite impressive. The company has employed 34% more capital in the last five years, and the returns on that capital have remained stable at 20%. Returns like this are the envy of most businesses and given it has repeatedly reinvested at these rates, that's even better. If Inta Bina Group Berhad can keep this up, we'd be very optimistic about its future.
On a separate but related note, it's important to know that Inta Bina Group Berhad has a current liabilities to total assets ratio of 61%, which we'd consider pretty high. This effectively means that suppliers (or short-term creditors) are funding a large portion of the business, so just be aware that this can introduce some elements of risk. While it's not necessarily a bad thing, it can be beneficial if this ratio is lower.
In Conclusion...
Inta Bina Group Berhad has demonstrated its proficiency by generating high returns on increasing amounts of capital employed, which we're thrilled about. On top of that, the stock has rewarded shareholders with a remarkable 106% return to those who've held over the last five years. So while investors seem to be recognizing these promising trends, we still believe the stock deserves further research.
On a final note, we've found 2 warning signs for Inta Bina Group Berhad that we think you should be aware of.
Inta Bina Group Berhad is not the only stock earning high returns. If you'd like to see more, check out our free list of companies earning high returns on equity with solid fundamentals.
Have feedback on this article? Concerned about the content? Get in touch with us directly. Alternatively, email editorial-team (at) simplywallst.com.
This article by Simply Wall St is general in nature. We provide commentary based on historical data and analyst forecasts only using an unbiased methodology and our articles are not intended to be financial advice. It does not constitute a recommendation to buy or sell any stock, and does not take account of your objectives, or your financial situation. We aim to bring you long-term focused analysis driven by fundamental data. Note that our analysis may not factor in the latest price-sensitive company announcements or qualitative material. Simply Wall St has no position in any stocks mentioned.
Have feedback on this article? Concerned about the content? Get in touch with us directly. Alternatively, email editorial-team@simplywallst.com
