
 Yahoo Finance
 5 Charts Expose Troubling Weaknesses In Record-High Stock Market: 'This Is Not Normal'

As the S&P 500 and Nasdaq 100 indices continue to notch new all-time highs, it’s clear that the rising tide has not lifted all boats.
Sharp-eyed analysts and investors have noted some discordant features in a stock market at its peak, raising questions about the euphoria that currently reigns supreme on Wall Street.
Mega-Cap Dominance Unprecedented Since Late 2008
The dominance of mega-cap stocks hasn’t been this pronounced in nearly sixteen years.
The top 100 U.S. stocks by market capitalization, monitored through the iShares S&P 100 ETF (NYSE:OEF), have never been stronger against the Russell 1000 Index, as tracked by the iShares Russell 1000 ETF (NYSE:IWB), since December 2008-.
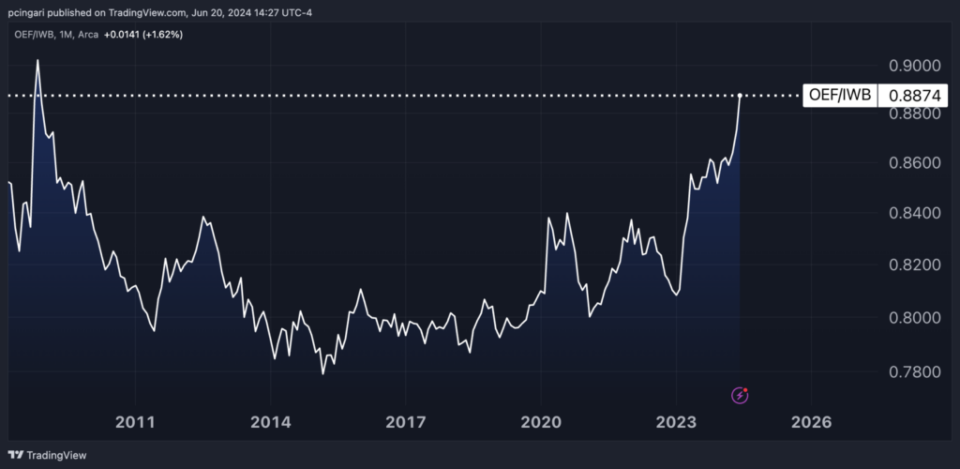
David Morrison, senior market Analyst at Trade Nation, commented, “There are concerns about the US market's lack of breadth with so much of the overall performance concentrated in the stock price of a few corporations. In fact, the five biggest companies by market capitalization in the S&P 500 account for nearly 30% of its value. The size and outperformance of this select group is reflected in its valuation, which is way above that of the rest of the constituents.”
Poor Participation In Market Rally
The current bull market rally lacks broad participation, with only a few companies driving the major indices higher.
The cap-weighted S&P 500 Index, tracked by the SPDR S&P 500 ETF Trust (NYSE:SPY), has surged to levels last seen in November 2008 when compared to its equally-weighted counterpart, represented by the Invesco S&P 500 Equal Weight ETF (NYSE:RSP).
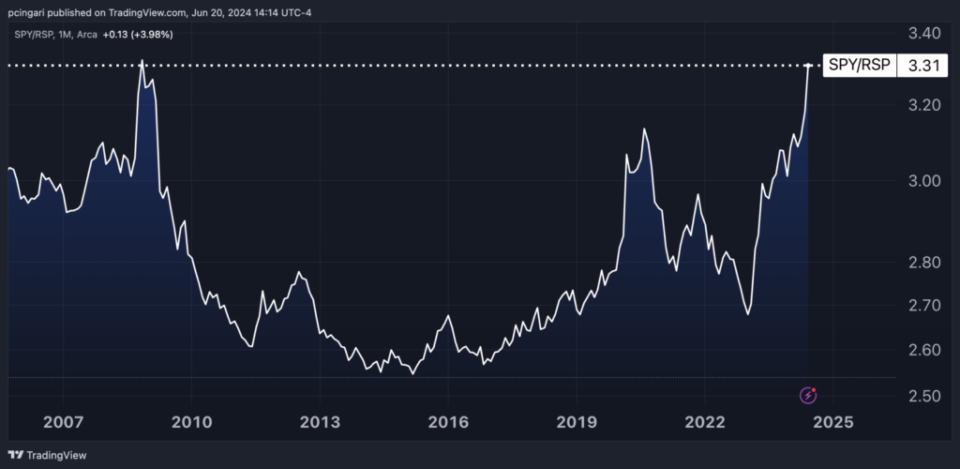
“We haven't had a four-week span where the US stock market has gone up so much with so many stocks within the market going down, based on data going back to 2002,” said Luke Kawa, markets editor at Sherwood.
SentimenTrader in a post on social media X, indicates that while the Nasdaq 100 continues to achieve record highs, many of its constituent stocks are underperforming, dropping to monthly, quarterly, or even yearly lows and falling below their 10-, 50-, and 200-day moving averages.
“This is not normal. In fact, it’s never happened before to this degree. There is a possibility that the average stock will catch up to the index, that is not how things usually pan out. Almost never, in fact. Risk is high in that index,” they wrote.
The Nasdaq 100 continues to notch record high after record high. Many of its stocks are not only lagging, but they're falling to monthly, quarterly, or even yearly lows and below their 10-, 50-, and 200-day moving averages.
This is not normal. In fact, it's never happened before... pic.twitter.com/gopsw8WUJn— SentimenTrader (@sentimentrader) June 17, 2024
Tech Supremacy Surpassing Historical Extremes
The tech sector has been the primary driver of the extreme relative valuations among major U.S. stock indices.
The Nasdaq 100, when compared to both the Dow Jones Industrial Average and the Russell 2000, is at historic highs, surpassing previous peaks seen during the dot-com bubble and in December 2021 at the end of the ultra-low interest rate era.

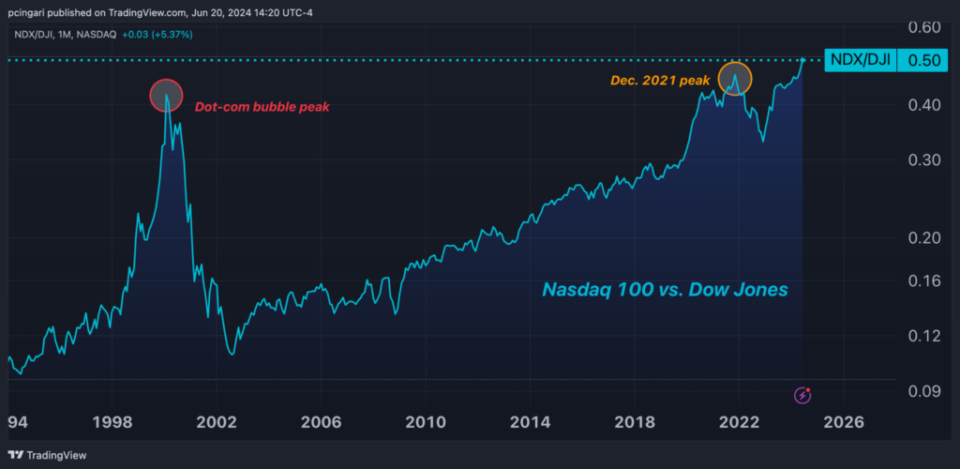
Image created using artificial intelligence via Midjourney.
"ACTIVE INVESTORS' SECRET WEAPON" Supercharge Your Stock Market Game with the #1 "news & everything else" trading tool: Benzinga Pro - Click here to start Your 14-Day Trial Now!
Get the latest stock analysis from Benzinga?
This article 5 Charts Expose Troubling Weaknesses In Record-High Stock Market: 'This Is Not Normal' originally appeared on Benzinga.com
© 2024 Benzinga.com. Benzinga does not provide investment advice. All rights reserved.
