
 Yahoo Finance
 20 Rich Cities Where the Average Household Income Is $200,000 or Higher
It’s commonly said that wages aren’t increasing at a rate matching inflation, but this doesn’t apply to everyone all the time. Throughout the United States, certain cities have seen a steady increase in mean household income over time. And although the cost of living continues to rise, so does the overall income of the residents of these cities.
For You: 8 Best Items To Buy at Dollar Tree To Resell on Amazon for Major Profits
Try This: Owe Money to the IRS? Most People Don’t Realize They Should Do This One Thing
While not everyone living in each city is rich — some are far from it, in fact — the numbers do indicate that people are becoming wealthier in specific areas. To further this point, GOBankingRates recently conducted a study to determine which cities have seen a mean household income over $200,000 in the past few years.
Based on that research, here are the richest cities based on household income.
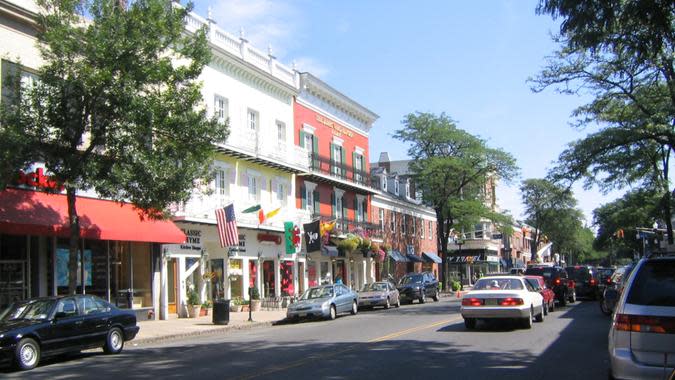
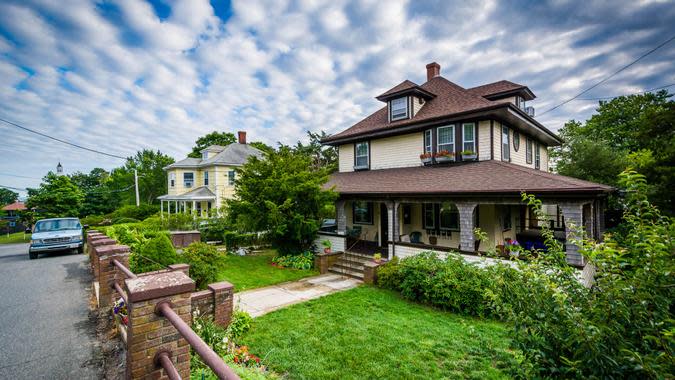
Westfield, New Jersey
2019 mean household income: $235,067
2022 mean household income: $281,738
3-year percentage change in mean household income: 19.85%
2019 % of population with $200k+ income: 43%
2022 % of population with $200k+ income: 50.8%
3-year percent change in population with a household income of $200,000+: 18.14%
Check Out: 30 Best Games That Pay Real Money in 2024
Learn More: 7 Unusual Ways To Make Extra Money (That Actually Work)
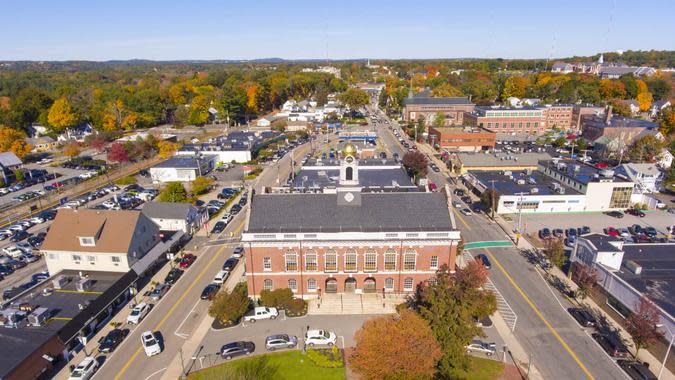
Needham, Massachusetts
2019 mean household income: $223,894
2022 mean household income: $267,951
3-year percentage change in mean household income: 19.68%
2019 % of population with $200k+ income: 39.1%
2022 % of population with $200k+ income: 51.7%
3-year percent change in population with a household income of $200,000+: 32.23%
Trending Now: Tony Robbins: 10 Passive Income Ideas To Build Your Fortune
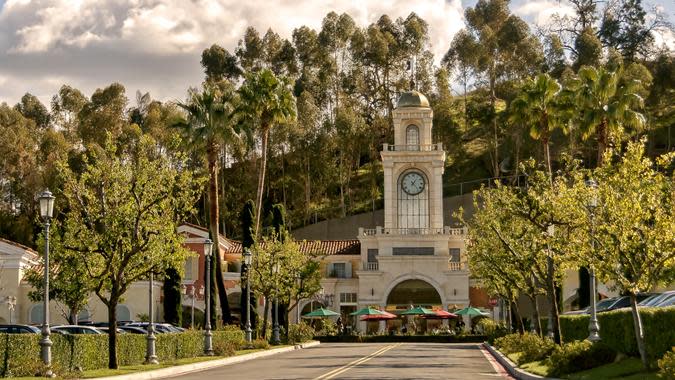
Calabasas, California
2019 mean household income: $201,446
2022 mean household income: $257,894
3-year percentage change in mean household income: 28.02%
2019 % of population with $200k+ income: 31.9%
2022 % of population with $200k+ income: 40.3%
3-year percent change in population with a household income of $200,000+: 26.33%
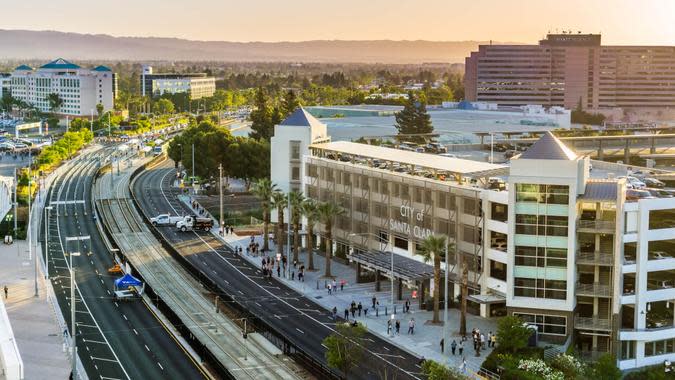
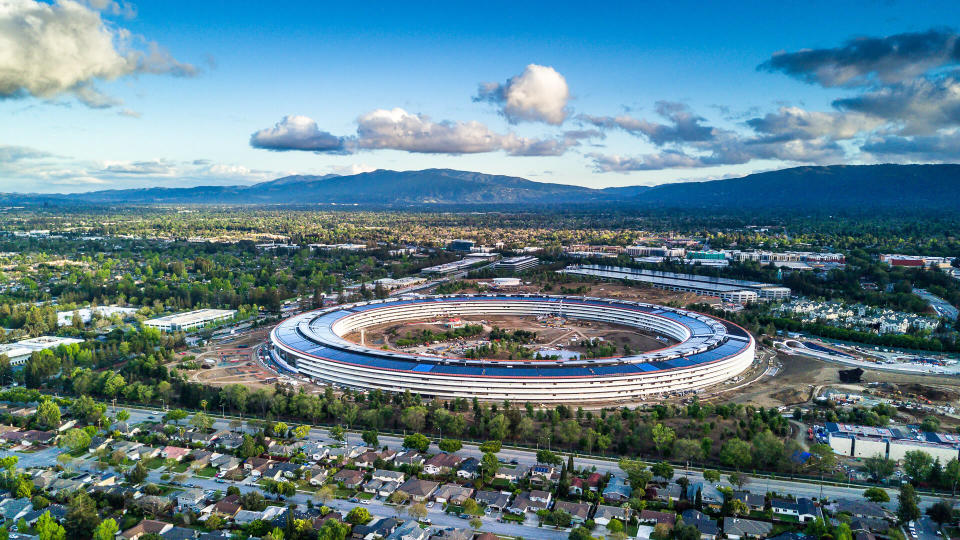
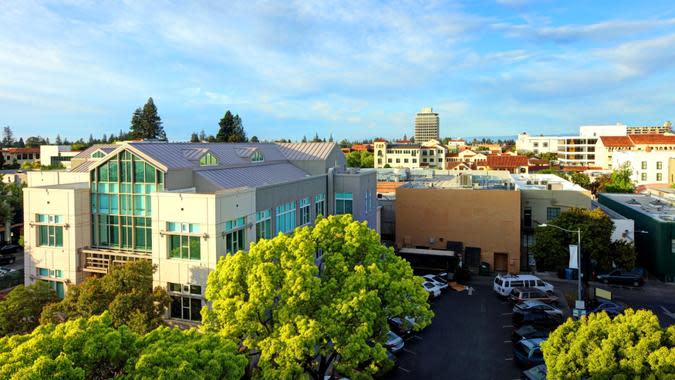
Santa Clara, California
2019 mean household income: $150,572
2022 mean household income: $206,379
3-year percentage change in mean household income: 37.06%
2019 % of population with $200k+ income: 25.5%
2022 % of population with $200k+ income: 39.8%
3-year percent change in population with a household income of $200,000+: 56.08%
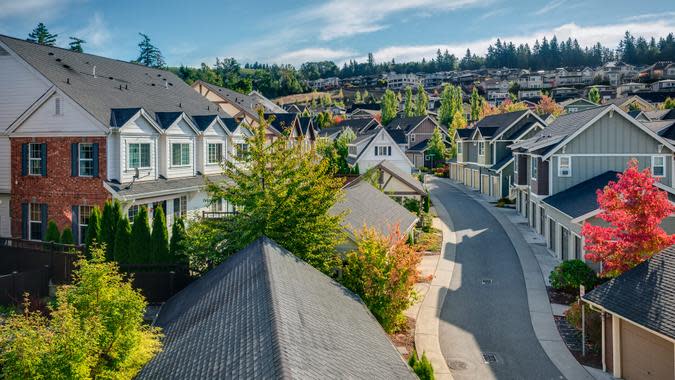
Issaquah, Washington
2019 mean household income: $137,332
2022 mean household income: $196,431
3-year percentage change in mean household income: 43.03%
2019 % of population with $200k+ income: 21.7%
2022 % of population with $200k+ income: 33.1%
3-year percent change in population with a household income of $200,000+: 52.53%
Winchester, Massachusetts
2019 mean household income: $227,899
2022 mean household income: $283,632
3-year percentage change in mean household income: 24.46%
2019 % of population with $200k+ income: 44.1%
2022 % of population with $200k+ income: 52.5%
3-year percent change in population with a household income of $200,000+: 19.05%
Check Out: 6 Best ChatGPT Prompts To Find Your High-Income Side Gig

Naples, Florida
2019 mean household income: $217,838
2022 mean household income: $277,872
3-year percentage change in mean household income: 27.56%
2019 % of population with $200k+ income: 29.2%
2022 % of population with $200k+ income: 35.1%
3-year percent change in population with a household income of $200,000+: 20.21%

San Carlos, California
2019 mean household income: $239,376
2022 mean household income: $298,397
3-year percentage change in mean household income: 24.66%
2019 % of population with $200k+ income: 45.5%
2022 % of population with $200k+ income: 53.2%
3-year percent change in population with a household income of $200,000+: 16.92%

Mercer Island, Washington
2019 mean household income: $224,619
2022 mean household income: $290,655
3-year percentage change in mean household income: 29.40%
2019 % of population with $200k+ income: 39.3%
2022 % of population with $200k+ income: 48.3%
3-year percent change in population with a household income of $200,000+: 22.90%

Bainbridge Island, Washington
2019 mean household income: $144,868
2022 mean household income: $214,501
3-year percentage change in mean household income: 48.07%
2019 % of population with $200k+ income: 23.1%
2022 % of population with $200k+ income: 36.2%
3-year percent change in population with a household income of $200,000+: 56.71%
Read Next: Dave Ramsey’s 10 Best Tips for Building Wealth: ‘Start Thinking Like Rich People’
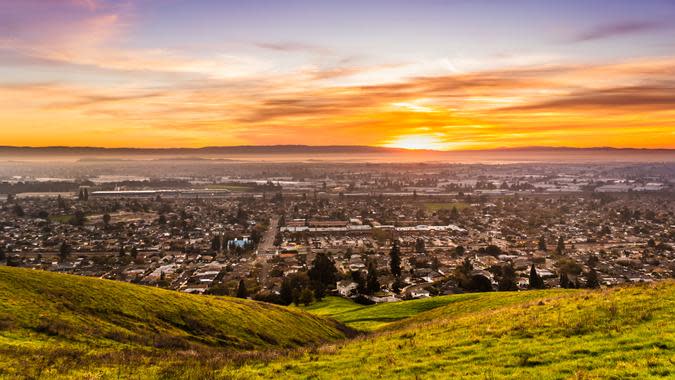
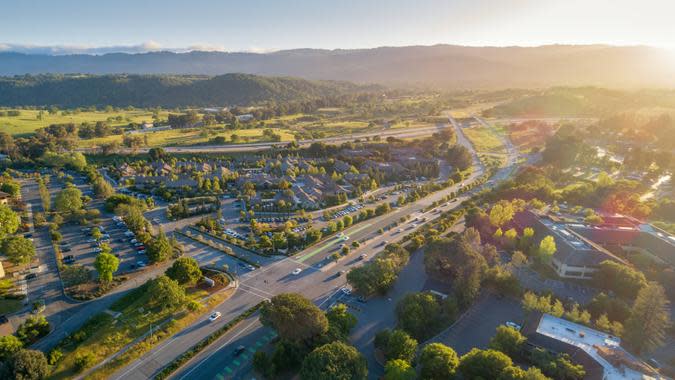
Lafayette, California
2019 mean household income: $250,550
2022 mean household income: $312,233
3-year percentage change in mean household income: 24.62%
2019 % of population with $200k+ income: 45.9%
2022 % of population with $200k+ income: 53.6%
3-year percent change in population with a household income of $200,000+: 16.78%
Pictured: Nearby Hayward, California
Palo Alto, California
2019 mean household income: $232,529
2022 mean household income: $301,226
3-year percentage change in mean household income: 29.54%
2019 % of population with $200k+ income: 41%
2022 % of population with $200k+ income: 52%
3-year percent change in population with a household income of $200,000+: 26.83%

Cupertino, California
2019 mean household income: $206,009
2022 mean household income: $283,063
3-year percentage change in mean household income: 37.40%
2019 % of population with $200k+ income: 42.1%
2022 % of population with $200k+ income: 54.7%
3-year percent change in population with a household income of $200,000+: 29.93%
Menlo Park, California
2019 mean household income: $241,222
2022 mean household income: $316,584
3-year percentage change in mean household income: 31.24%
2019 % of population with $200k+ income: 40.4%
2022 % of population with $200k+ income: 49.2%
3-year percent change in population with a household income of $200,000+: 21.78%
Explore More: How I Make $5,000 a Month in Passive Income Doing Just 10 Hours of Work a Year

Saratoga, California
2019 mean household income: $257,441
2022 mean household income: $329,142
3-year percentage change in mean household income: 27.85%
2019 % of population with $200k+ income: 47.8%
2022 % of population with $200k+ income: 58.3%
3-year percent change in population with a household income of $200,000+: 21.97%

Southlake, Texas
2019 mean household income: $299,637
2022 mean household income: $360,078
3-year percentage change in mean household income: 20.17%
2019 % of population with $200k+ income: 58.5%
2022 % of population with $200k+ income: 64.3%
3-year percent change in population with a household income of $200,000+: 9.91%
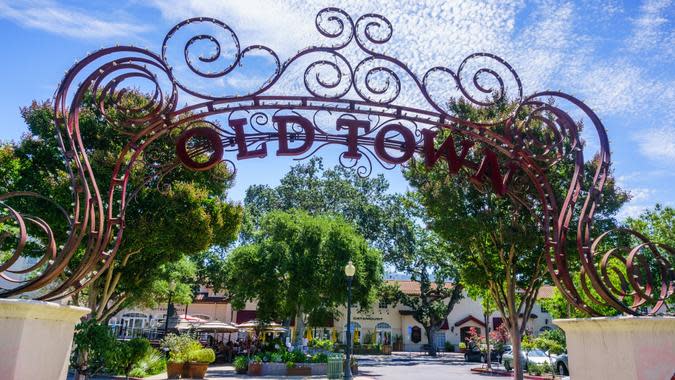
Los Gatos, California
2019 mean household income: $217,966
2022 mean household income: $305,653
3-year percentage change in mean household income: 40.23%
2019 % of population with $200k+ income: 40.3%
2022 % of population with $200k+ income: 49.5%
3-year percent change in population with a household income of $200,000+: 22.83%

McLean, Virginia
2019 mean household income: $296,594
2022 mean household income: $364,093
3-year percentage change in mean household income: 22.76%
2019 % of population with $200k+ income: 52.1%
2022 % of population with $200k+ income: 61.8%
3-year percent change in population with a household income of $200,000+: 18.62%
Find Out: How To Become a Millionaire in Your 60s
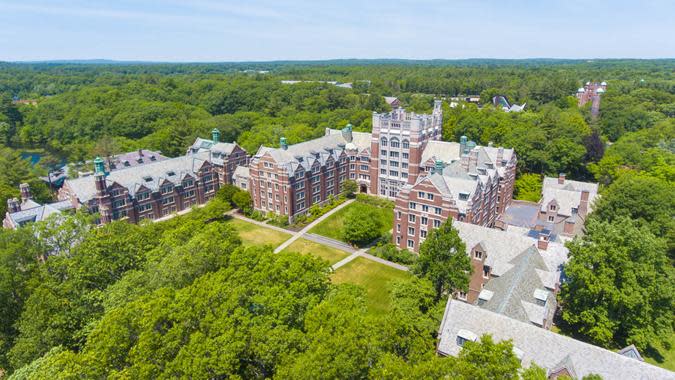
Wellesley, Massachusetts
2019 mean household income: $287,793
2022 mean household income: $367,801
3-year percentage change in mean household income: 27.80%
2019 % of population with $200k+ income: 49.3%
2022 % of population with $200k+ income: 60.7%
3-year percent change in population with a household income of $200,000+: 23.12%
Los Altos, California
2019 mean household income: $326,456
2022 mean household income: $400,817
3-year percentage change in mean household income: 22.78%
2019 % of population with $200k+ income: 57.6%
2022 % of population with $200k+ income: 64.2%
3-year percent change in population with a household income of $200,000+: 11.46%
Methodology: For this piece GOBankingRates first took the 100 cities with the highest mean household income and with a minimum of 7,500 total households as sourced from the 2022 American Community Survey as conducted by the US Census Bureau. With these cities selected, GOBankingRates then found each city’s: (1) 2019 mean household income; (2) 2022 mean household income; (3) three-year percent change in mean household income; (4) 2019 percent of population with a household income of $200,000+; (5) 2022 percent of population with a household income of $200,000+; and (6) three-year percent change in population with a household income of $200,000+. Factors (2), (3) and (5) were then scored and combined with the lowest score being best. In final calculations factor (2) weighed 4x and factor (3) was weighted 2x. All data was collected and is up to date as of Feb. 7, 2024.
More From GOBankingRates
Suze Orman: 5 Social Security Facts Every Soon-To-Be Retiree Must Know
Avoid These 7 Cars That Will Only Last You Half as Long as the Average Vehicle
The Biggest Mistake People Make With Their Tax Refund -- And How to Avoid It
This article originally appeared on GOBankingRates.com: 20 Rich Cities Where the Average Household Income Is $200,000 or Higher