Singapore markets closed
Straits Times Index
3,323.20 -6.89 (-0.21%) S&P 500
5,306.04 +1.32 (+0.02%) Dow
38,852.86 -216.74 (-0.55%) Nasdaq
17,019.88 +99.08 (+0.59%) Bitcoin USD
67,847.42 -674.53 (-0.98%) CMC Crypto 200
1,462.66 -22.03 (-1.48%)
SA Real Estate Securities Fund (SARLX)
Nasdaq - Nasdaq Delayed price. Currency in USD
Add to watchlist
At close: 09:00PM EDT
SA Real Estate Securities Fund
San Jose, CA 95128
3055 Olin Avenue Suite 2000
SA Funds Investment Trust
Management information
John A. Hertzer,Lead manager since 30 December 2021
Mr. Hertzer joined DFA in 2013. Mr. Hertzer began his investment career in 2004 and earned a B.A. from Dartmouth College and an M.B.A. from the University of California Los Angeles.
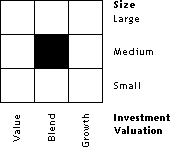
Morningstar style box
Yahoo partners with Morningstar, a leading market research and investment data group to help investors rate and compare funds on Yahoo Finance. The Morningstar Category is shown next to the Morningstar Style Box, which identifies a fund's investment focus, based on the underlying securities in the fund.
Morningstar category
While the investment objective stated in a fund's prospectus may or may not reflect how the fund actually invests, the Morningstar category is assigned based on the underlying securities in each portfolio. Morningstar categories help investors and investment professionals make meaningful comparisons between funds. The categories make it easier to build well-diversified portfolios, assess potential risk and identify top-performing funds. We place funds in a given category based on their portfolio statistics and compositions over the past three years. If the fund is new and has no portfolio history, we estimate where it will fall before giving it a more permanent category assignment. Where necessary, we may change a category assignment based on recent changes to the portfolio.
Fund overview
CategoryReal Estate
Fund familySA Funds
Net assets109.92M
YTD return-27.60%
Yield1.34%
Morningstar rating★★★
Inception date1 Apr 2007
Fund operations
Last dividend0.16
Last cap gain50.00
Holdings turnover2.00%
Average for categoryN/A
Fees and expenses
ExpenseSARLXCategory average
Annual report expense ratio (net)0.76%1.08%
Prospectus net expense ratio0.76%N/A
Prospectus gross expense ratio0.86%N/A
Max 12b1 feeN/AN/A
Max front end sales loadN/A5.10%
Max deferred sales loadN/A1.13%
3-yr expense projection0N/A
5-yr expense projection0N/A
10-yr expense projection0N/A
© 2024 Yahoo. All rights reserved.