
 Yahoo Finance
 Zijin Mining Group Co Ltd's Dividend Analysis
Exploring the Dividend Performance and Sustainability of Zijin Mining Group Co Ltd
Zijin Mining Group Co Ltd (ZIJMF) recently announced a dividend of $0.22 per share, payable on 2024-06-28, with the ex-dividend date set for 2024-05-21. As investors look forward to this upcoming payment, the spotlight also shines on the company's dividend history, yield, and growth rates. Using the data from GuruFocus, let's look into Zijin Mining Group Co Ltd's dividend performance and assess its sustainability.
What Does Zijin Mining Group Co Ltd Do?
This Powerful Chart Made Peter Lynch 29% A Year For 13 Years
How to calculate the intrinsic value of a stock?
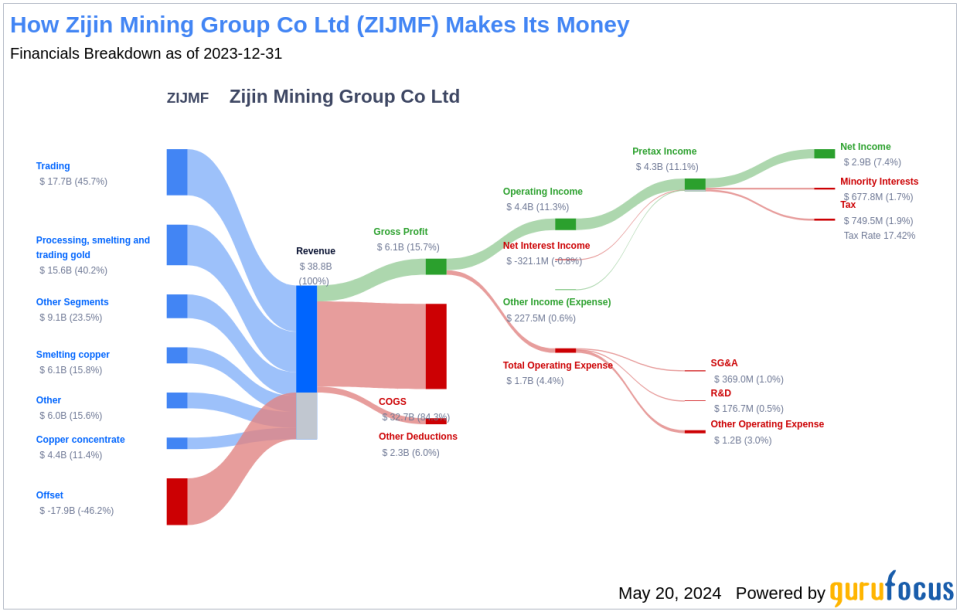
Zijin Mining Group Co Ltd focuses on the exploration and development of gold, copper, and other metal mineral resources. The company operates through various segments, including Gold bullion; Processed, refined, and trading gold; Gold concentrates; Electrolytic copper & electrodeposited copper; Refined copper; Copper concentrates; Other concentrates; Zinc bullion, Environmental protection, trading, and others. It generates maximum revenue from the Processed, refined & trading gold segment. This segment is engaged in the production of gold bullion by processing gold concentrates produced by the group or purchased from external suppliers and gold bullion in the business of physical gold trading. Geographically, the majority of its revenue is derived from Mainland China.
A Glimpse at Zijin Mining Group Co Ltd's Dividend History
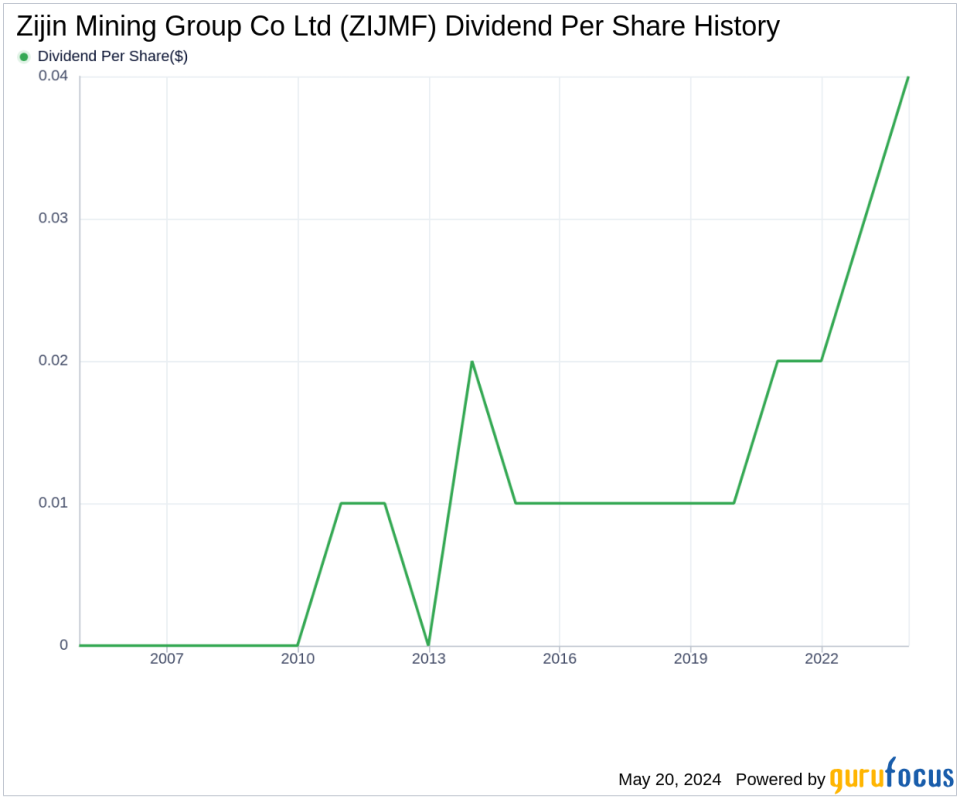
Zijin Mining Group Co Ltd has maintained a consistent dividend payment record since 2013. Dividends are currently distributed on a bi-annually basis. Below is a chart showing annual Dividends Per Share for tracking historical trends.
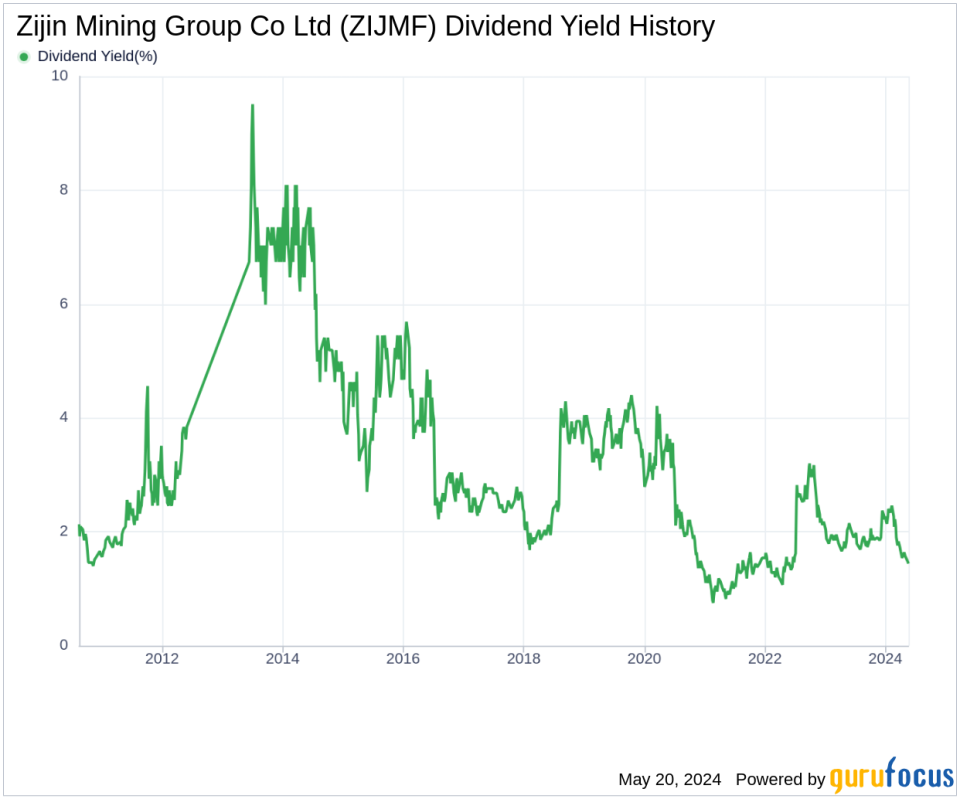
Breaking Down Zijin Mining Group Co Ltd's Dividend Yield and Growth
As of today, Zijin Mining Group Co Ltd currently has a 12-month trailing dividend yield of 1.43% and a 12-month forward dividend yield of 2.58%. This suggests an expectation of increased dividend payments over the next 12 months. Over the past three years, Zijin Mining Group Co Ltd's annual dividend growth rate was 35.70%. Extended to a five-year horizon, this rate decreased to 23.40% per year. And over the past decade, Zijin Mining Group Co Ltd's annual dividends per share growth rate stands at an impressive 10.50%.
Based on Zijin Mining Group Co Ltd's dividend yield and five-year growth rate, the 5-year yield on cost of Zijin Mining Group Co Ltd stock as of today is approximately 4.09%.
The Sustainability Question: Payout Ratio and Profitability
To assess the sustainability of the dividend, one needs to evaluate the company's payout ratio. The dividend payout ratio provides insights into the portion of earnings the company distributes as dividends. A lower ratio suggests that the company retains a significant part of its earnings, thereby ensuring the availability of funds for future growth and unexpected downturns. As of 2024-03-31, Zijin Mining Group Co Ltd's dividend payout ratio is 0.29.
Zijin Mining Group Co Ltd's profitability rank, offers an understanding of the company's earnings prowess relative to its peers. GuruFocus ranks Zijin Mining Group Co Ltd's profitability 9 out of 10 as of 2024-03-31, suggesting good profitability prospects. The company has reported positive net income for each year over the past decade, further solidifying its high profitability.
Growth Metrics: The Future Outlook
To ensure the sustainability of dividends, a company must have robust growth metrics. Zijin Mining Group Co Ltd's growth rank of 9 out of 10 suggests that the company's growth trajectory is good relative to its competitors. Revenue is the lifeblood of any company, and Zijin Mining Group Co Ltd's revenue per share, combined with the 3-year revenue growth rate, indicates a strong revenue model. Zijin Mining Group Co Ltd's revenue has increased by approximately 19.00% per year on average, a rate that outperforms approximately 70.03% of global competitors. The company's 3-year EPS growth rate showcases its capability to grow its earnings, a critical component for sustaining dividends in the long run. During the past three years, Zijin Mining Group Co Ltd's earnings increased by approximately 48.60% per year on average, a rate that outperforms approximately 90.57% of global competitors. Lastly, the company's 5-year EBITDA growth rate of 37.80%, which outperforms approximately 88.22% of global competitors.
Conclusion
Zijin Mining Group Co Ltd's consistent dividend payments, robust dividend growth rate, manageable payout ratio, strong profitability, and impressive growth metrics position it as a potentially attractive option for value investors focused on dividend income. As the company continues to expand and capitalize on market opportunities, it may well sustain or even increase its dividend payouts. Investors interested in high-dividend yield stocks may find Zijin Mining Group Co Ltd a compelling case for inclusion in their portfolios.
GuruFocus Premium users can screen for high-dividend yield stocks using the High Dividend Yield Screener.
This article, generated by GuruFocus, is designed to provide general insights and is not tailored financial advice. Our commentary is rooted in historical data and analyst projections, utilizing an impartial methodology, and is not intended to serve as specific investment guidance. It does not formulate a recommendation to purchase or divest any stock and does not consider individual investment objectives or financial circumstances. Our objective is to deliver long-term, fundamental data-driven analysis. Be aware that our analysis might not incorporate the most recent, price-sensitive company announcements or qualitative information. GuruFocus holds no position in the stocks mentioned herein.
This article first appeared on GuruFocus.
