
 Yahoo Finance
 ZEAL Network's (ETR:TIMA) investors will be pleased with their impressive 123% return over the last five years
Stock pickers are generally looking for stocks that will outperform the broader market. And while active stock picking involves risks (and requires diversification) it can also provide excess returns. For example, the ZEAL Network SE (ETR:TIMA) share price is up 77% in the last 5 years, clearly besting the market decline of around 0.1% (ignoring dividends). On the other hand, the more recent gains haven't been so impressive, with shareholders gaining just 4.5%, including dividends.
So let's assess the underlying fundamentals over the last 5 years and see if they've moved in lock-step with shareholder returns.
View our latest analysis for ZEAL Network
There is no denying that markets are sometimes efficient, but prices do not always reflect underlying business performance. By comparing earnings per share (EPS) and share price changes over time, we can get a feel for how investor attitudes to a company have morphed over time.
ZEAL Network's earnings per share are down 16% per year, despite strong share price performance over five years.
Essentially, it doesn't seem likely that investors are focused on EPS. Because earnings per share don't seem to match up with the share price, we'll take a look at other metrics instead.
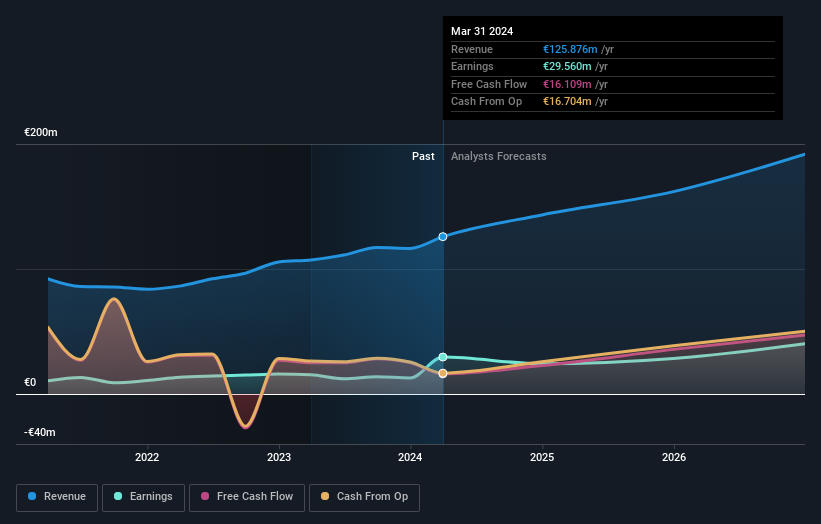
It is not great to see that revenue has dropped by 2.9% per year over five years. It certainly surprises us that the share price is up, but perhaps a closer examination of the data will yield answers.
The company's revenue and earnings (over time) are depicted in the image below (click to see the exact numbers).
We know that ZEAL Network has improved its bottom line over the last three years, but what does the future have in store? If you are thinking of buying or selling ZEAL Network stock, you should check out this FREE detailed report on its balance sheet.
What About Dividends?
When looking at investment returns, it is important to consider the difference between total shareholder return (TSR) and share price return. The TSR incorporates the value of any spin-offs or discounted capital raisings, along with any dividends, based on the assumption that the dividends are reinvested. So for companies that pay a generous dividend, the TSR is often a lot higher than the share price return. In the case of ZEAL Network, it has a TSR of 123% for the last 5 years. That exceeds its share price return that we previously mentioned. And there's no prize for guessing that the dividend payments largely explain the divergence!
A Different Perspective
ZEAL Network provided a TSR of 4.5% over the last twelve months. But that return falls short of the market. It's probably a good sign that the company has an even better long term track record, having provided shareholders with an annual TSR of 17% over five years. It may well be that this is a business worth popping on the watching, given the continuing positive reception, over time, from the market. It's always interesting to track share price performance over the longer term. But to understand ZEAL Network better, we need to consider many other factors. Consider for instance, the ever-present spectre of investment risk. We've identified 1 warning sign with ZEAL Network , and understanding them should be part of your investment process.
If you like to buy stocks alongside management, then you might just love this free list of companies. (Hint: many of them are unnoticed AND have attractive valuation).
Please note, the market returns quoted in this article reflect the market weighted average returns of stocks that currently trade on German exchanges.
Have feedback on this article? Concerned about the content? Get in touch with us directly. Alternatively, email editorial-team (at) simplywallst.com.
This article by Simply Wall St is general in nature. We provide commentary based on historical data and analyst forecasts only using an unbiased methodology and our articles are not intended to be financial advice. It does not constitute a recommendation to buy or sell any stock, and does not take account of your objectives, or your financial situation. We aim to bring you long-term focused analysis driven by fundamental data. Note that our analysis may not factor in the latest price-sensitive company announcements or qualitative material. Simply Wall St has no position in any stocks mentioned.
Have feedback on this article? Concerned about the content? Get in touch with us directly. Alternatively, email editorial-team@simplywallst.com
