
 Yahoo Finance
 Williams Companies (NYSE:WMB) Is Looking To Continue Growing Its Returns On Capital
Finding a business that has the potential to grow substantially is not easy, but it is possible if we look at a few key financial metrics. One common approach is to try and find a company with returns on capital employed (ROCE) that are increasing, in conjunction with a growing amount of capital employed. Basically this means that a company has profitable initiatives that it can continue to reinvest in, which is a trait of a compounding machine. So on that note, Williams Companies (NYSE:WMB) looks quite promising in regards to its trends of return on capital.
What Is Return On Capital Employed (ROCE)?
If you haven't worked with ROCE before, it measures the 'return' (pre-tax profit) a company generates from capital employed in its business. Analysts use this formula to calculate it for Williams Companies:
Return on Capital Employed = Earnings Before Interest and Tax (EBIT) ÷ (Total Assets - Current Liabilities)
0.081 = US$3.9b ÷ (US$53b - US$5.0b) (Based on the trailing twelve months to March 2024).
So, Williams Companies has an ROCE of 8.1%. In absolute terms, that's a low return and it also under-performs the Oil and Gas industry average of 13%.
View our latest analysis for Williams Companies
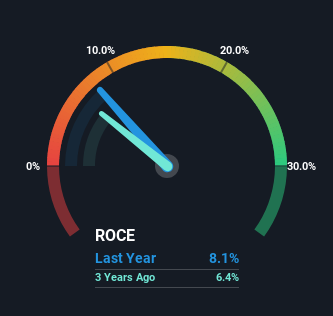
Above you can see how the current ROCE for Williams Companies compares to its prior returns on capital, but there's only so much you can tell from the past. If you're interested, you can view the analysts predictions in our free analyst report for Williams Companies .
The Trend Of ROCE
Williams Companies has not disappointed with their ROCE growth. Looking at the data, we can see that even though capital employed in the business has remained relatively flat, the ROCE generated has risen by 68% over the last five years. So our take on this is that the business has increased efficiencies to generate these higher returns, all the while not needing to make any additional investments. It's worth looking deeper into this though because while it's great that the business is more efficient, it might also mean that going forward the areas to invest internally for the organic growth are lacking.
What We Can Learn From Williams Companies' ROCE
To sum it up, Williams Companies is collecting higher returns from the same amount of capital, and that's impressive. Since the stock has returned a staggering 112% to shareholders over the last five years, it looks like investors are recognizing these changes. Therefore, we think it would be worth your time to check if these trends are going to continue.
One more thing, we've spotted 2 warning signs facing Williams Companies that you might find interesting.
If you want to search for solid companies with great earnings, check out this free list of companies with good balance sheets and impressive returns on equity.
Have feedback on this article? Concerned about the content? Get in touch with us directly. Alternatively, email editorial-team (at) simplywallst.com.
This article by Simply Wall St is general in nature. We provide commentary based on historical data and analyst forecasts only using an unbiased methodology and our articles are not intended to be financial advice. It does not constitute a recommendation to buy or sell any stock, and does not take account of your objectives, or your financial situation. We aim to bring you long-term focused analysis driven by fundamental data. Note that our analysis may not factor in the latest price-sensitive company announcements or qualitative material. Simply Wall St has no position in any stocks mentioned.
Have feedback on this article? Concerned about the content? Get in touch with us directly. Alternatively, email editorial-team@simplywallst.com
