
 Yahoo Finance
 What valuations can and can't tell us about the stock market
Just because valuations are high at a given moment does not mean the next 12 months’ return will be weak.
A version of this post originally appeared on TKer.co
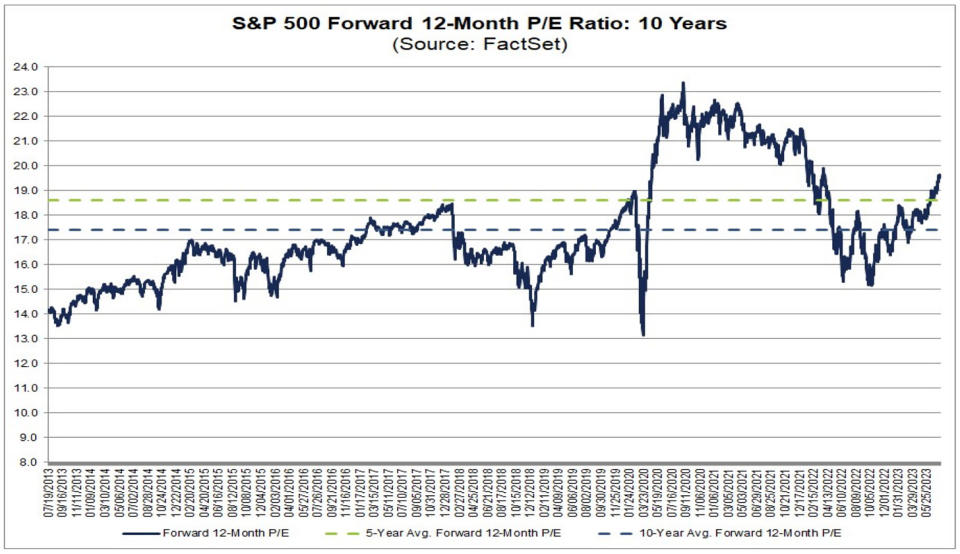
Stocks climbed last week with the S&P 500 rising 0.7% to close at 4,536.34. The index is now up 18.1% year to date, up 26.8% from its October 12 closing low of 3,577.03, and down 5.4% from its January 3, 2022 record closing high of 4,796.56.
In the stock market, do valuation metrics like price-to-earnings (P/E) multiples matter?
Of course they do!
However, they don’t appear to be very helpful when predicting short-term moves in prices.
In a blog published on Tuesday, Nick Maggiulli of Ritholtz Wealth Management addressed "The Problem with Valuation." Here’s a brief excerpt:
…there is nothing that says that these metrics have to return to their long-term averages. In fact, I believe the opposite. Valuation multiples are likely to stay above their historical norms for the foreseeable future. Why?Because investing is much simpler today than it used to be. With the rise of cheap diversification over the last half century, investors today are willing to accept lower future returns (i.e. higher valuations) than their predecessors. This has fundamentally changed valuation metrics and made historical comparisons less useful than they once were.
I think Nick is right. And I think we sometimes take for granted how much the frictions and costs have come down for those seeking to trade or invest in stocks.
On Thursday, I joined Jack Raines, Josh Brown, and Michael Batnick on The Compound And Friends podcast (listen to it here!). We spent a good amount of time wrestling with issues related to valuations.
Jack pointed out that trading fees have been coming down for decades, which certainly justify higher valuation premiums — if it costs less to trade, then the returns you require should probably be lower.
Another critical point to remember is that interest rates have been trending lower for the better part of the past four decades. Experts ranging from Robert Shiller to Warren Buffett to Jeremy Grantham have argued lower rates justify higher average valuations.
Perhaps the most disturbing observation about P/E ratios comes from Goldman Sachs. In a research note published a little over a year ago, Goldman analysts concluded (emphasis added):
While valuations feature importantly in our toolbox to estimate forward equity returns, we should dispel an oft-repeated myth that equity valuations are mean-reverting… We have not found any statistical evidence of mean reversion… Equity valuations are a bounded time series: there is some upper bound since valuations cannot reach infinity, and there is a lower bound since valuations cannot go below zero. However, having upper and lower bounds does not imply valuations are stationary and revert to the same long-term mean.
So just because you can calculate an average does not mean what you’re observing has a tendency to gravitate toward that average over time.
Maybe you’re not willing to accept what we’ve discussed here so far. Then, at least consider this: While there is some historical evidence that valuations may tell you something about long-term returns, that data also shows valuations tell you almost nothing about where stocks will go in the following 12 months.

JPMorgan analysts ran the historical numbers. As the chart to the left shows, there is effectively no linear relationship between valuations and one-year returns. In other words, an expensive valuation doesn’t necessarily increase the likelihood that the following year’s returns will be weak. Similarly, a cheap valuation doesn’t necessarily increase the likelihood that the following year’s returns will be strong.
If this sounds familiar, it’s because it’s TKer Stock Market Truth No. 6: Valuations won’t tell you much about the next year.
To be fair, the chart on the right suggests there may be a relationship between valuations and longer-term returns. Specifically, high valuations may mean lower average returns over rolling five-year periods. But as Nick notes: "while future returns do seem lower, when we will experience them is anyone’s guess."
The bottom line is that you should use valuation metrics like the P/E ratio with caution. Just because valuations are high at a given moment does not mean the next 12 months’ return will be weak.
Reviewing the macro crosscurrents
There were a few notable data points and macroeconomic developments from last week to consider:
🛍️ Consumers are still spending. According to Census Bureau data (via Notes), retail sales in June climbed 0.2% to $689.5 billion. While the pace of sales is off its record high, it continues to trend well above pre-pandemic levels.

From Wells Fargo: "Most remarkable is that control group sales, which feeds into estimates from PCE spending, came in +0.6%, or twice the 0.3% that had been expected. By excluding autos, gas, building materials and restaurants, this category gives a sense of the underlying trend in spending. The trend is stubbornly good. Credit e-commerce for that. The category that puts packages on porches was up 1.9% in June, the second largest increase of any store type… Slowing goods inflation is freeing up cash for consumers, and helping overall spending remain steady."
🛠️ Industrial activity cools. Industrial production activity in June declined 0.5% from May levels, with manufacturing output declining 0.3%.

Manufacturing surveys are mixed. The New York Fed’s July Empire State Manufacturing Survey (via Notes) signaled a modest improvement in general business conditions during the month. Interestingly, prices paid and received cooled during the month while the number of employees and average workweek ticked higher.

The Philly Fed’s July Manufacturing Business Outlook Survey signaled declining activity in the region during the month. However, those surveyed were much more optimistic about the future. From the report: "The diffusion index for future general activity jumped from a reading of 12.7 in June to 29.1 in July, the index’s highest reading since August 2021.
Nearly 40% of the firms expect an increase in activity over the next six months (up from 33% last month), and 11% expect a decrease (down from 20%); 46% expect no change (up from 44%). The future new orders index climbed 24 points to 38.2, while the future shipments index rose 9 points to 37.3. On balance, the firms continued to expect increases in employment over the next six months, and the future employment index increased from a reading of 13.1 to 21.3."

Keep in mind that during times of stress, soft data tends to be more exaggerated than actual hard data.
Home sales cooled. Sales of previously owned homes fell 3.3% in June to an annualized rate of 4.16 million units. From NAR chief economist Lawrence Yun: "Fewer Americans were on the move despite the usual life-changing circumstances. The pent-up demand will surely be realized soon, especially if mortgage rates and inventory move favorably."

Home prices ticked up. Prices for previously owned homes rose month over month and were up from year-ago levels. From the NAR: "The median existing-home price for all housing types in June was $410,200, the second-highest price of all time and down 0.9% from the record-high of $413,800 in June 2022. The monthly median price surpassed $400,000 for the third time, joining June 2022 and May 2022 ($408,600). Prices rose in the Northeast and Midwest but waned in the South and West."

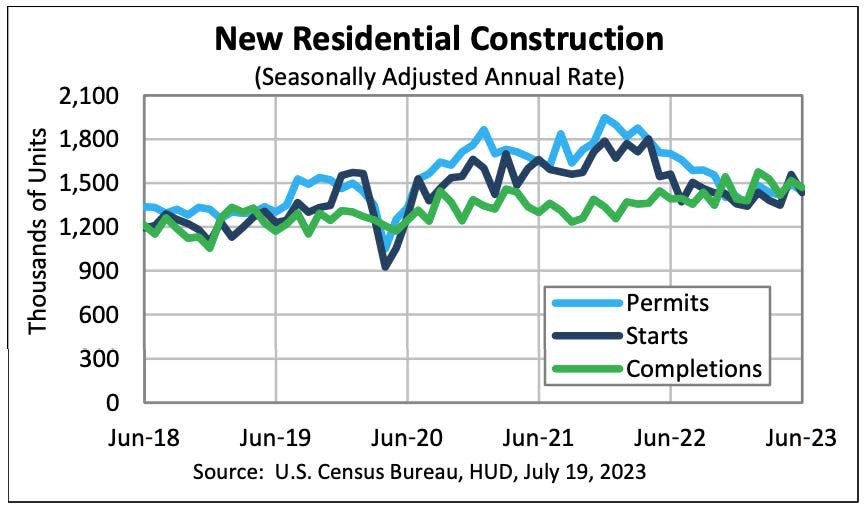
Home builder sentiment improves. From the NAHB: "Low existing inventory that is keeping demand solid for new homes helped to push builder confidence up in July even as the industry continues to grapple with rising mortgage rates, elevated construction costs and limited lot availability."

From NAHB Chief Economist Robert Dietz: "Although builders continue to remain cautiously optimistic about market conditions, the quarter-point rise in mortgage rates over the past month is a stark reminder of the stop and start process the market will experience as the Federal Reserve nears the end of the ongoing tightening cycle."
New home construction ticks down. Housing starts declined 8.0% in June to an annualized rate of 1.43 million units, according to the Census Bureau. Building permits fell 3.7% to an annualized rate of 1.44 million units.
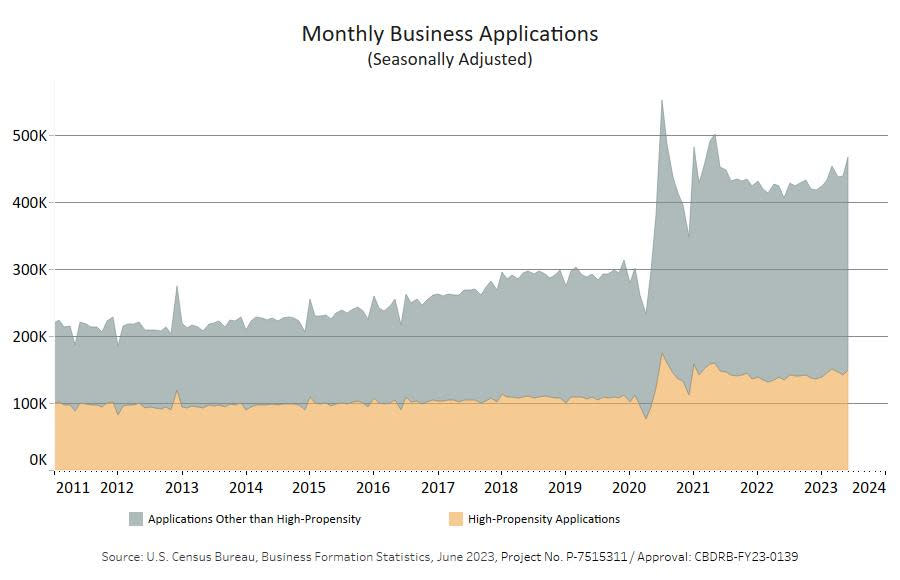
The entrepreneurial spirit is alive. From the Census Bureau: "June 2023 Business Applications were 465,906, up 6.2% (seasonally adjusted) from May 2023. Of those, 149,536 were High-Propensity Business Applications."
The pros are worried about stuff. According to BofA’s June Global Fund Manager Survey (via Notes), fund managers identified high inflation keeping central banks hawkish as the "biggest tail risk."
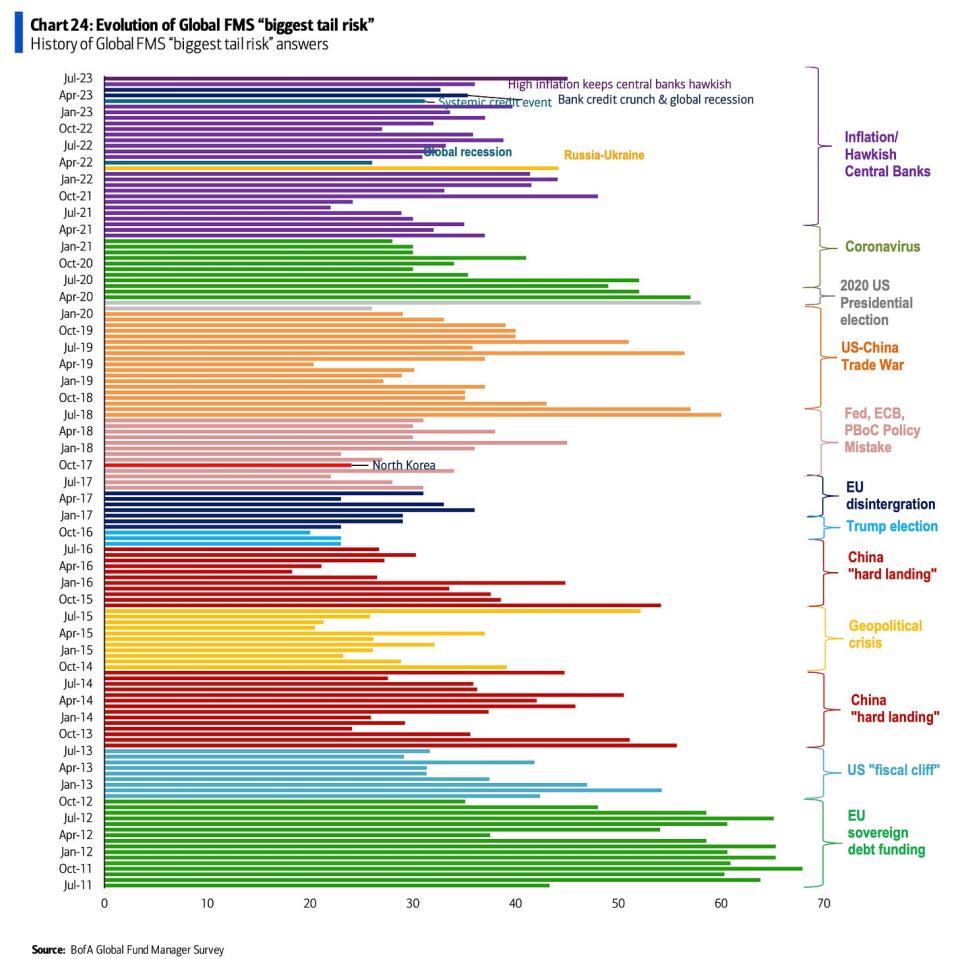
The truth is we’re always worried about something. That’s just the nature of investing.
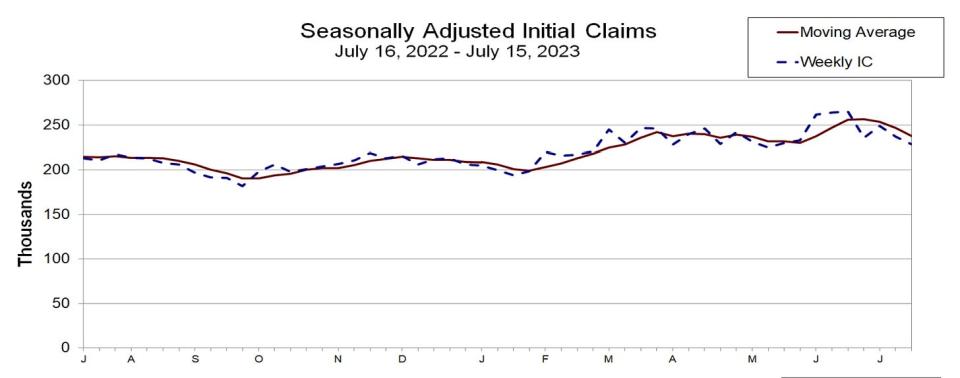
Unemployment claims tick down. Initial claims for unemployment benefits fell to 228,000 during the week ending July 15, down from 237,000 the week prior. While this is up from the September low of 182,000, it continues to trend at levels associated with economic growth.
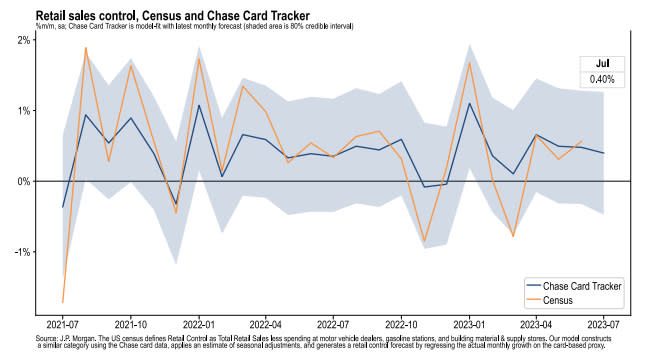
Card spending growth is positive. From JPMorgan Chase: "As of 16 Jul 2023, our Chase Consumer Card spending data (unadjusted) was 3.0% above the same day last year. Based on the Chase Consumer Card data through 16 Jul 2023, our estimate of the US Census July control measure of retail sales m/m is 0.40%."
From Bank of America: "Total card spending per HH was up 0.8% y/y in the week ending Jul 15, according to BAC aggregated credit and debit card data. Airline, entertainment & transit spending picked up on a y/y basis in the last week, while most goods categories decelerated. The increase in online retail spending around Prime Day and related promotions was similar to last year."

Near-term GDP growth estimates remain positive. The Atlanta Fed’s GDPNow model sees real GDP growth climbing at a 2.4% rate in Q2. While the model’s estimate is off its high, it’s nevertheless very positive and up from its initial estimate of 1.7% growth as of April 28.

Putting it all together 🤔
We continue to get evidence that we could see a bullish "Goldilocks" soft landing scenario where inflation cools to manageable levels without the economy having to sink into recession.
The Federal Reserve recently adopted a less hawkish tone, acknowledging on February 1 that "for the first time that the disinflationary process has started." On May 3, the Fed signaled that the end of interest rate hikes may be here. And at its June 14 policy meeting, it kept rates unchanged, ending a streak of 10 consecutive rate hikes.
In any case, inflation still has to come down more before the Fed is comfortable with price levels. So we should expect the central bank to keep monetary policy tight, which means we should be prepared for tight financial conditions (e.g. higher interest rates, tighter lending standards, and lower stock valuations) to linger.
All of this means monetary policy will be unfriendly to markets for the time being, and the risk that the economy sinks into a recession will be relatively elevated.
At the same time, we also know that stocks are discounting mechanisms, meaning that prices will have bottomed before the Fed signals a major dovish turn in monetary policy.
Also, it’s important to remember that while recession risks may be elevated, consumers are coming from a very strong financial position. Unemployed people are getting jobs. Those with jobs are getting raises. And many still have excess savings to tap into. Indeed, strong spending data confirms this financial resilience. So it’s too early to sound the alarm from a consumption perspective.
At this point, any downturn is unlikely to turn into economic calamity given that the financial health of consumers and businesses remains very strong.
And as always, long-term investors should remember that recessions and bear markets are just part of the deal when you enter the stock market with the aim of generating long-term returns. While markets have had a pretty rough couple of years, the long-run outlook for stocks remains positive.
A version of this post originally appeared on TKer.co
Click here for the latest stock market news and in-depth analysis, including events that move stocks
Read the latest financial and business news from Yahoo Finance
