
 Yahoo Finance
 Will Weakness in XPEL, Inc.'s (NASDAQ:XPEL) Stock Prove Temporary Given Strong Fundamentals?
XPEL (NASDAQ:XPEL) has had a rough three months with its share price down 45%. However, a closer look at its sound financials might cause you to think again. Given that fundamentals usually drive long-term market outcomes, the company is worth looking at. Specifically, we decided to study XPEL's ROE in this article.
Return on equity or ROE is an important factor to be considered by a shareholder because it tells them how effectively their capital is being reinvested. In simpler terms, it measures the profitability of a company in relation to shareholder's equity.
View our latest analysis for XPEL
How Do You Calculate Return On Equity?
Return on equity can be calculated by using the formula:
Return on Equity = Net Profit (from continuing operations) ÷ Shareholders' Equity
So, based on the above formula, the ROE for XPEL is:
26% = US$48m ÷ US$186m (Based on the trailing twelve months to March 2024).
The 'return' is the amount earned after tax over the last twelve months. So, this means that for every $1 of its shareholder's investments, the company generates a profit of $0.26.
What Is The Relationship Between ROE And Earnings Growth?
Thus far, we have learned that ROE measures how efficiently a company is generating its profits. Based on how much of its profits the company chooses to reinvest or "retain", we are then able to evaluate a company's future ability to generate profits. Assuming all else is equal, companies that have both a higher return on equity and higher profit retention are usually the ones that have a higher growth rate when compared to companies that don't have the same features.
A Side By Side comparison of XPEL's Earnings Growth And 26% ROE
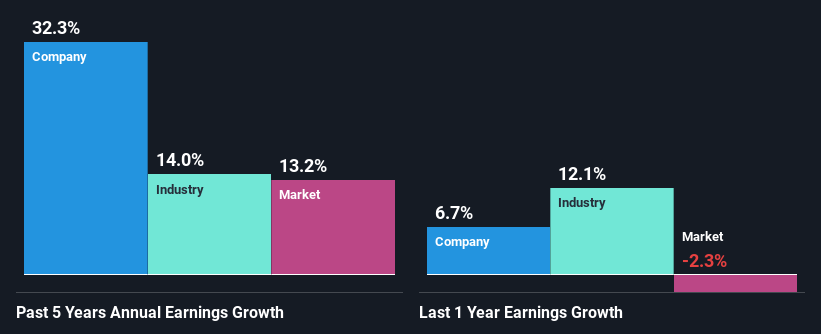
First thing first, we like that XPEL has an impressive ROE. Additionally, the company's ROE is higher compared to the industry average of 12% which is quite remarkable. So, the substantial 32% net income growth seen by XPEL over the past five years isn't overly surprising.
We then compared XPEL's net income growth with the industry and we're pleased to see that the company's growth figure is higher when compared with the industry which has a growth rate of 14% in the same 5-year period.
The basis for attaching value to a company is, to a great extent, tied to its earnings growth. What investors need to determine next is if the expected earnings growth, or the lack of it, is already built into the share price. By doing so, they will have an idea if the stock is headed into clear blue waters or if swampy waters await. What is XPEL worth today? The intrinsic value infographic in our free research report helps visualize whether XPEL is currently mispriced by the market.
Is XPEL Using Its Retained Earnings Effectively?
XPEL doesn't pay any regular dividends currently which essentially means that it has been reinvesting all of its profits into the business. This definitely contributes to the high earnings growth number that we discussed above.
Summary
In total, we are pretty happy with XPEL's performance. Particularly, we like that the company is reinvesting heavily into its business, and at a high rate of return. Unsurprisingly, this has led to an impressive earnings growth. That being so, a study of the latest analyst forecasts show that the company is expected to see a slowdown in its future earnings growth. To know more about the company's future earnings growth forecasts take a look at this free report on analyst forecasts for the company to find out more.
Have feedback on this article? Concerned about the content? Get in touch with us directly. Alternatively, email editorial-team (at) simplywallst.com.
This article by Simply Wall St is general in nature. We provide commentary based on historical data and analyst forecasts only using an unbiased methodology and our articles are not intended to be financial advice. It does not constitute a recommendation to buy or sell any stock, and does not take account of your objectives, or your financial situation. We aim to bring you long-term focused analysis driven by fundamental data. Note that our analysis may not factor in the latest price-sensitive company announcements or qualitative material. Simply Wall St has no position in any stocks mentioned.
Have feedback on this article? Concerned about the content? Get in touch with us directly. Alternatively, email editorial-team@simplywallst.com
