
 Yahoo Finance
 Be Wary Of Karin Technology Holdings (SGX:K29) And Its Returns On Capital
If we're looking to avoid a business that is in decline, what are the trends that can warn us ahead of time? Typically, we'll see the trend of both return on capital employed (ROCE) declining and this usually coincides with a decreasing amount of capital employed. This reveals that the company isn't compounding shareholder wealth because returns are falling and its net asset base is shrinking. In light of that, from a first glance at Karin Technology Holdings (SGX:K29), we've spotted some signs that it could be struggling, so let's investigate.
What Is Return On Capital Employed (ROCE)?
Just to clarify if you're unsure, ROCE is a metric for evaluating how much pre-tax income (in percentage terms) a company earns on the capital invested in its business. Analysts use this formula to calculate it for Karin Technology Holdings:
Return on Capital Employed = Earnings Before Interest and Tax (EBIT) ÷ (Total Assets - Current Liabilities)
0.057 = HK$25m ÷ (HK$1.2b - HK$764m) (Based on the trailing twelve months to December 2023).
So, Karin Technology Holdings has an ROCE of 5.7%. In absolute terms, that's a low return but it's around the Electronic industry average of 7.0%.
See our latest analysis for Karin Technology Holdings
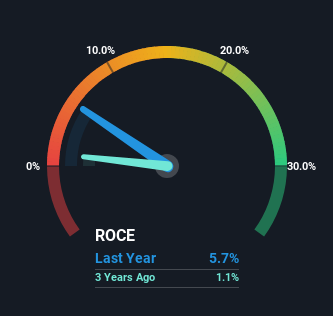
Historical performance is a great place to start when researching a stock so above you can see the gauge for Karin Technology Holdings' ROCE against it's prior returns. If you're interested in investigating Karin Technology Holdings' past further, check out this free graph covering Karin Technology Holdings' past earnings, revenue and cash flow.
The Trend Of ROCE
There is reason to be cautious about Karin Technology Holdings, given the returns are trending downwards. To be more specific, the ROCE was 8.4% five years ago, but since then it has dropped noticeably. On top of that, it's worth noting that the amount of capital employed within the business has remained relatively steady. This combination can be indicative of a mature business that still has areas to deploy capital, but the returns received aren't as high due potentially to new competition or smaller margins. If these trends continue, we wouldn't expect Karin Technology Holdings to turn into a multi-bagger.
On a separate but related note, it's important to know that Karin Technology Holdings has a current liabilities to total assets ratio of 63%, which we'd consider pretty high. This effectively means that suppliers (or short-term creditors) are funding a large portion of the business, so just be aware that this can introduce some elements of risk. Ideally we'd like to see this reduce as that would mean fewer obligations bearing risks.
What We Can Learn From Karin Technology Holdings' ROCE
In summary, it's unfortunate that Karin Technology Holdings is generating lower returns from the same amount of capital. Yet despite these concerning fundamentals, the stock has performed strongly with a 57% return over the last five years, so investors appear very optimistic. Regardless, we don't feel too comfortable with the fundamentals so we'd be steering clear of this stock for now.
One more thing, we've spotted 3 warning signs facing Karin Technology Holdings that you might find interesting.
While Karin Technology Holdings isn't earning the highest return, check out this free list of companies that are earning high returns on equity with solid balance sheets.
Have feedback on this article? Concerned about the content? Get in touch with us directly. Alternatively, email editorial-team (at) simplywallst.com.
This article by Simply Wall St is general in nature. We provide commentary based on historical data and analyst forecasts only using an unbiased methodology and our articles are not intended to be financial advice. It does not constitute a recommendation to buy or sell any stock, and does not take account of your objectives, or your financial situation. We aim to bring you long-term focused analysis driven by fundamental data. Note that our analysis may not factor in the latest price-sensitive company announcements or qualitative material. Simply Wall St has no position in any stocks mentioned.
