
 Yahoo Finance
 Be Wary Of FoundPac Group Berhad (KLSE:FPGROUP) And Its Returns On Capital
If you're not sure where to start when looking for the next multi-bagger, there are a few key trends you should keep an eye out for. Firstly, we'd want to identify a growing return on capital employed (ROCE) and then alongside that, an ever-increasing base of capital employed. Put simply, these types of businesses are compounding machines, meaning they are continually reinvesting their earnings at ever-higher rates of return. In light of that, when we looked at FoundPac Group Berhad (KLSE:FPGROUP) and its ROCE trend, we weren't exactly thrilled.
What Is Return On Capital Employed (ROCE)?
Just to clarify if you're unsure, ROCE is a metric for evaluating how much pre-tax income (in percentage terms) a company earns on the capital invested in its business. The formula for this calculation on FoundPac Group Berhad is:
Return on Capital Employed = Earnings Before Interest and Tax (EBIT) ÷ (Total Assets - Current Liabilities)
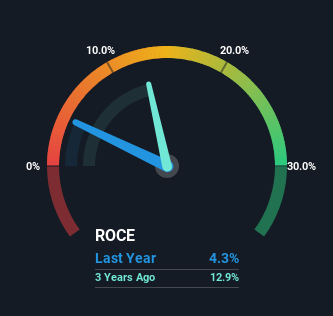
0.043 = RM4.8m ÷ (RM123m - RM9.6m) (Based on the trailing twelve months to March 2024).
Thus, FoundPac Group Berhad has an ROCE of 4.3%. Ultimately, that's a low return and it under-performs the Semiconductor industry average of 7.5%.
Check out our latest analysis for FoundPac Group Berhad
While the past is not representative of the future, it can be helpful to know how a company has performed historically, which is why we have this chart above. If you want to delve into the historical earnings , check out these free graphs detailing revenue and cash flow performance of FoundPac Group Berhad.
The Trend Of ROCE
When we looked at the ROCE trend at FoundPac Group Berhad, we didn't gain much confidence. To be more specific, ROCE has fallen from 16% over the last five years. And considering revenue has dropped while employing more capital, we'd be cautious. If this were to continue, you might be looking at a company that is trying to reinvest for growth but is actually losing market share since sales haven't increased.
In Conclusion...
From the above analysis, we find it rather worrisome that returns on capital and sales for FoundPac Group Berhad have fallen, meanwhile the business is employing more capital than it was five years ago. But investors must be expecting an improvement of sorts because over the last five yearsthe stock has delivered a respectable 42% return. Regardless, we don't feel too comfortable with the fundamentals so we'd be steering clear of this stock for now.
FoundPac Group Berhad does come with some risks though, we found 4 warning signs in our investment analysis, and 2 of those are a bit unpleasant...
For those who like to invest in solid companies, check out this free list of companies with solid balance sheets and high returns on equity.
Have feedback on this article? Concerned about the content? Get in touch with us directly. Alternatively, email editorial-team (at) simplywallst.com.
This article by Simply Wall St is general in nature. We provide commentary based on historical data and analyst forecasts only using an unbiased methodology and our articles are not intended to be financial advice. It does not constitute a recommendation to buy or sell any stock, and does not take account of your objectives, or your financial situation. We aim to bring you long-term focused analysis driven by fundamental data. Note that our analysis may not factor in the latest price-sensitive company announcements or qualitative material. Simply Wall St has no position in any stocks mentioned.
Have feedback on this article? Concerned about the content? Get in touch with us directly. Alternatively, email editorial-team@simplywallst.com
