The Upper Class Has Taken Over These 30 Cities

The gap between the middle and upper classes appears to be shrinking.
A surprising 50% of Americans made up the middle class as of 2021. If that seems high, however, 61% of Americans identified as middle class in 1971, so that figure has dropped significantly amid the rising cost of living. Perhaps it’s because of considerable income disparity across the country’s most popular cities.
Find Out: 3 Places To Travel That Are Like Hawaii but Way Cheaper
Read More: 6 Unusual Ways To Make Extra Money (That Actually Work)
With the middle class shrinking, there has also been a shift for the lower- and upper-income tiers. As the middle class has shrunk, the number of adults in the upper-income tier has increased from 14% in 1971 to 21% in 2021, according to Pew. But so has the lower-income tier, which increased from 25% to 29%.
This could be the case for certain cities’ growth, especially ones fueled by rising industries, based on current economic trends. And it seems the upper class might congregate on the West Coast, and largely in California.
GOBankingRates looked at all United States cities with above 40,000 households, as sourced from the 2022 American Community Surveys conducted by the United States Census Bureau, in order to find the 30 cities where the upper class has taken over, and what the five-year percent change in households was. All data was compiled on and up to date as of Feb. 13, 2024.
More than half of America’s richest cities are in California, with 17 of the locales on this study’s list from the Golden State. Other states with more than one city represented included well-known cities in Oregon and Colorado. Others like Nevada, Virginia, Idaho Texas and Arizona had one city each.
Check out which cities are being priced out.

Lewisville, Texas
Total households in 2022: 48,725
Upper-class households in 2017: 8.8%
Upper-class households in 2022: 20.8%
5-year change in upper-class households: 136.36%
Explore More: Barbara Corcoran: Here’s Why I Never Fly First Class
Read Next: How To Get $340 Per Year in Cash Back on Gas and Other Things You Already Buy
Wealthy people know the best money secrets. Learn how to copy them.
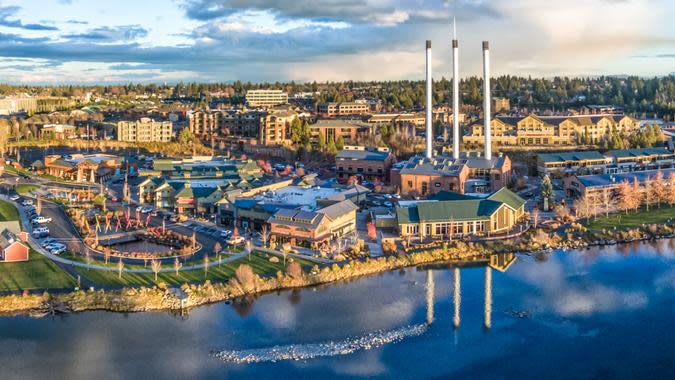
Bend, Oregon
Total households in 2022: 42,151
Upper-class households in 2017: 10.2%
Upper-class households in 2022: 24.1%
5-year change in upper-class households: 136.27%
Check Out: 7 Vacation Destinations To Avoid on a Retirement Budget
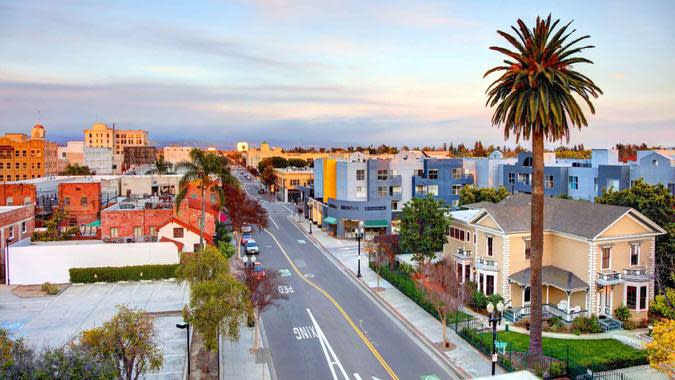
Santa Ana, California
Total households in 2022: 77,553
Upper-class households in 2017: 9%
Upper-class households in 2022: 21.2%
5-year change in upper-class households: 135.56%
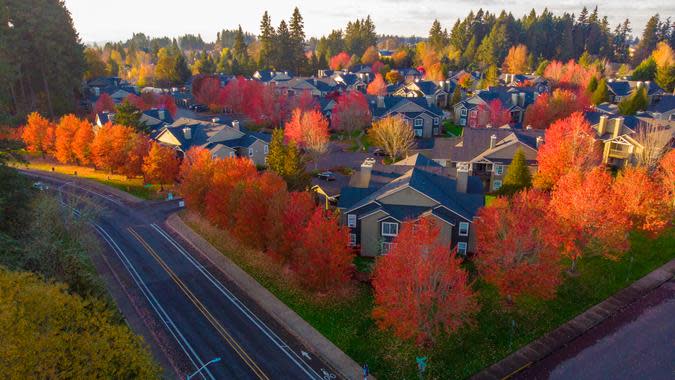
Hillsboro, Oregon
Total households in 2022: 40,633
Upper-class households in 2017: 13%
Upper-class households in 2022: 27.5%
5-year change in upper-class households: 111.54%
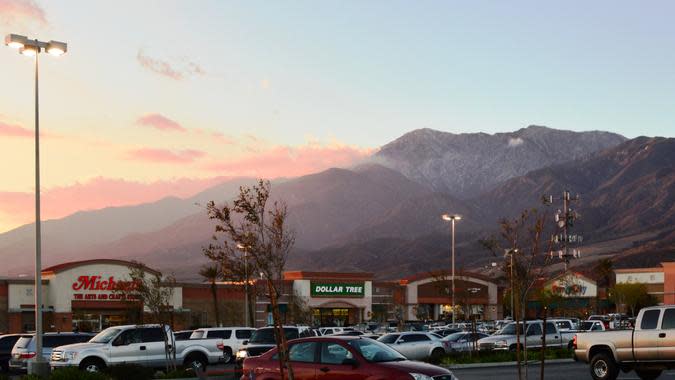
Fontana, California
Total households in 2022: 55,856
Upper-class households in 2017: 11.1%
Upper-class households in 2022: 23.4%
5-year change in upper-class households: 110.81%
Discover More: 10 Best US Vacation Destinations for Retirees on a Budget

Chula Vista, California
Total households in 2022: 83,074
Upper-class households in 2017: 13.8%
Upper-class households in 2022: 28.7%
5-year change in upper-class households: 107.97%
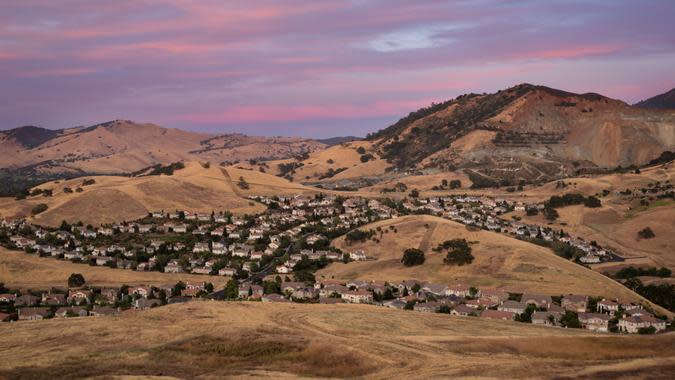
Concord, California
Total households in 2022: 45,574
Upper-class households in 2017: 15.7%
Upper-class households in 2022: 32.6%
5-year change in upper-class households: 107.64%
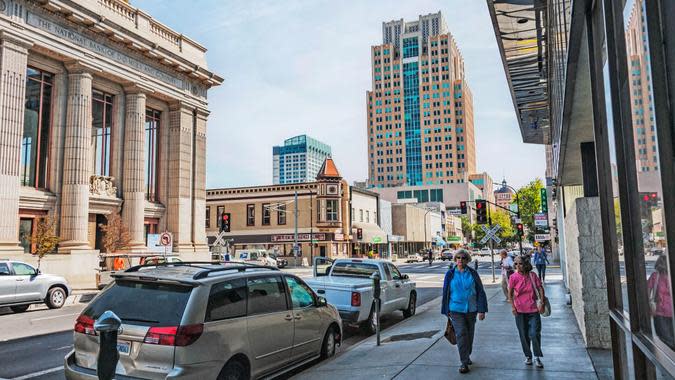
Clovis, California
Total households in 2022: 40,135
Upper-class households in 2017: 14.6%
Upper-class households in 2022: 29.8%
5-year change in upper-class households: 104.11%
Find Out: Dave Ramsey: 7 Vacation Splurges That Are a Waste of Money
Pictured: Sacramento, California

Kent, Washington
Total households in 2022: 45,699
Upper-class households in 2017: 11.6%
Upper-class households in 2022: 23.3%
5-year change in upper-class households: 100.86%
Pictured: Puget Sound, Washington
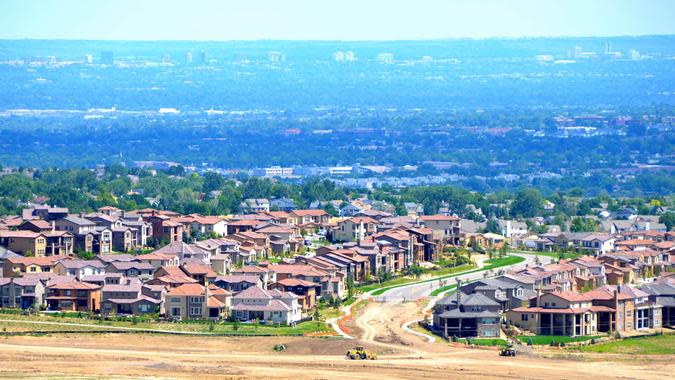
Lakewood, Colorado
Total households in 2022: 68,111
Upper-class households in 2017: 10.9%
Upper-class households in 2022: 21.8%
5-year change in upper-class households: 100%

Vallejo, California
Total households in 2022: 44,107
Upper-class households in 2017: 11.9%
Upper-class households in 2022: 23.7%
5-year change in upper-class households: 99.16%
Explore More: 11 Expensive Vacation Destinations That Will Be Cheaper in 2024
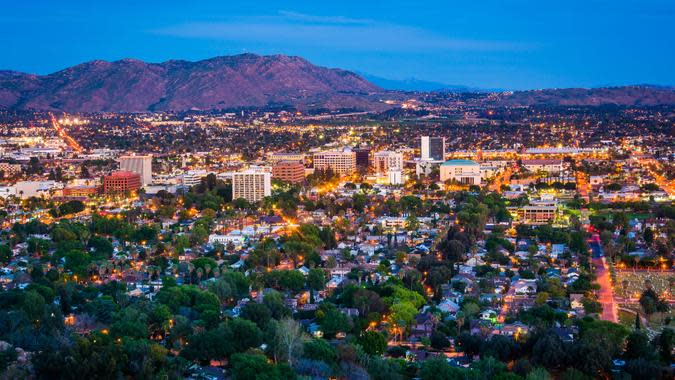
Riverside, California
Total households in 2022: 90,540
Upper-class households in 2017: 10.9%
Upper-class households in 2022: 21.7%
5-year change in upper-class households: 99.08%
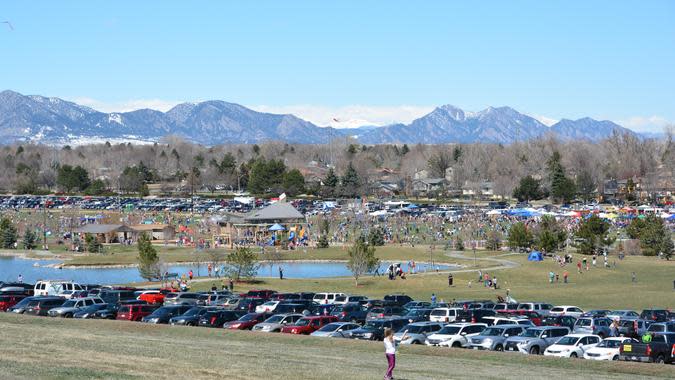
Arvada, Colorado
Total households in 2022: 50,211
Upper-class households in 2017: 15.9%
Upper-class households in 2022: 31.1%
5-year change in upper-class households: 95.60%
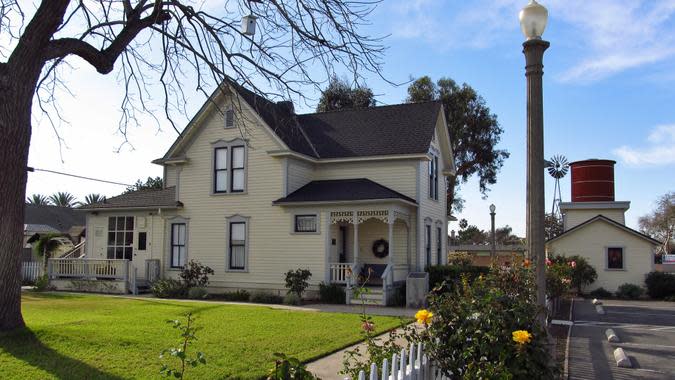
Garden Grove, California
Total households in 2022: 48,183
Upper-class households in 2017: 12%
Upper-class households in 2022: 23.4%
5-year change in upper-class households: 95%
Read Next: 8 Tips To Fly Business Class for the Price of Economy
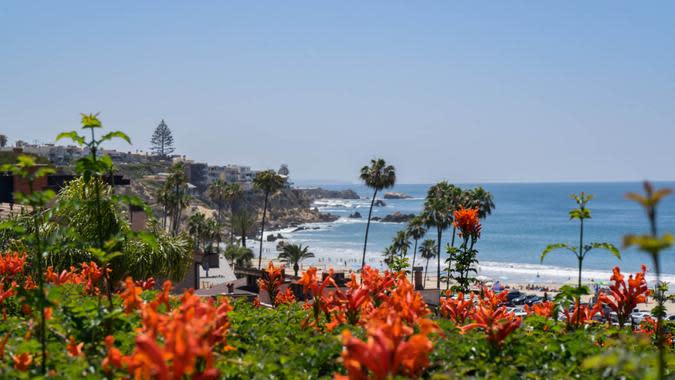
Corona, California
Total households in 2022: 46,524
Upper-class households in 2017: 15.4%
Upper-class households in 2022: 29.9%
5-year change in upper-class households: 94.16%
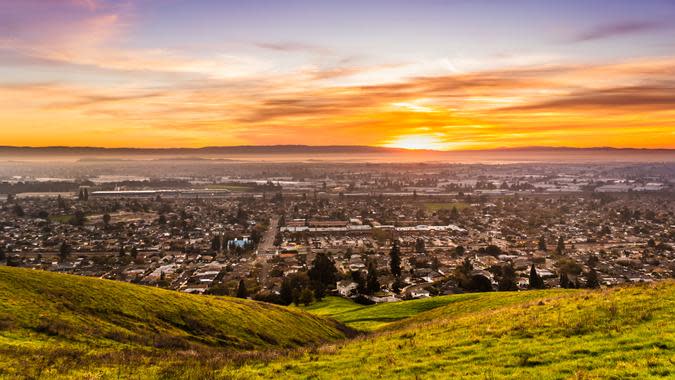
Hayward, California
Total households in 2022: 49,542
Upper-class households in 2017: 16.6%
Upper-class households in 2022: 32.1%
5-year change in upper-class households: 93.37%
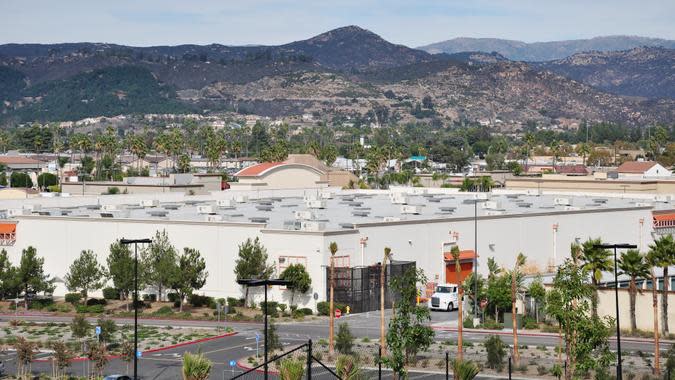
Escondido, California
Total households in 2022: 51,288
Upper-class households in 2017: 10.9%
Upper-class households in 2022: 20.9%
5-year change in upper-class households: 91.74%
Check Out: 9 American Travel Brands To Stay Away From

Beaverton, Oregon
Total households in 2022: 40,812
Upper-class households in 2017: 12.9%
Upper-class households in 2022: 24.7%
5-year change in upper-class households: 91.47%

Peoria, Arizona
Total households in 2022: 71,733
Upper-class households in 2017: 12.5%
Upper-class households in 2022: 23.9%
5-year change in upper-class households: 91.20%
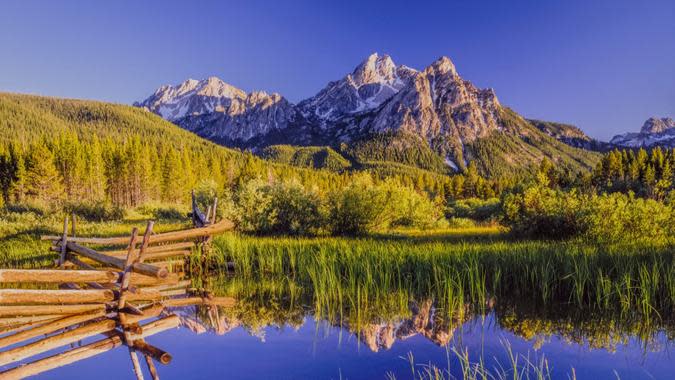
Meridien, Idaho
Total households in 2022: 42,843
Upper-class households in 2017: 12%
Upper-class households in 2022: 22.7%
5-year change in upper-class households: 89.17%
Discover More: Billionaires vs. the Middle Class: Who Pays More in Taxes?
Pictured: Sawtooth National Forest, Idaho
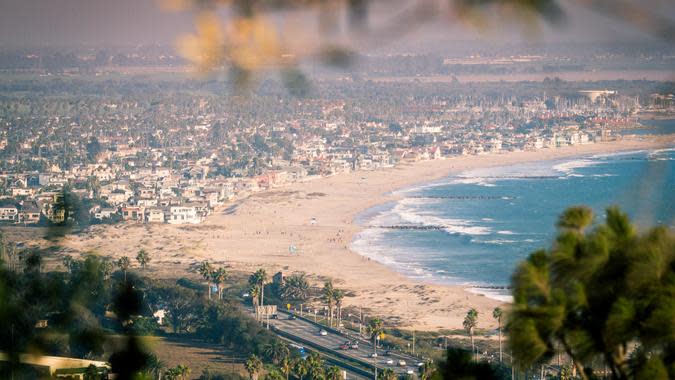
Ventura, California
Total households in 2022: 41,954
Upper-class households in 2017: 14.4%
Upper-class households in 2022: 27.1%
5-year change in upper-class households: 88.19%
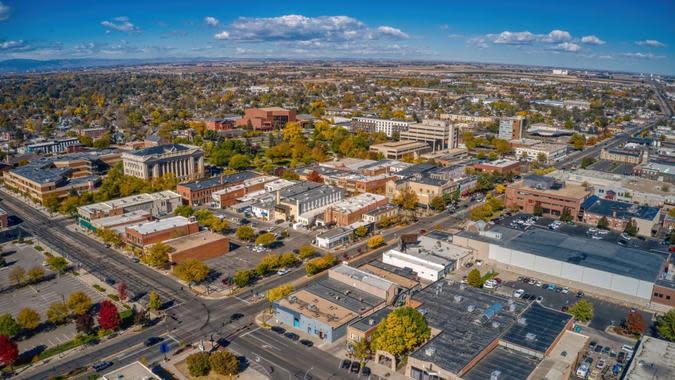
Thornton, Colorado
Total households in 2022: 48,466
Upper-class households in 2017: 12.7%
Upper-class households in 2022: 23.8%
5-year change in upper-class households: 87.40%
Pictured: Greeley, Colorado

Santa Rosa, California
Total households in 2022: 68,096
Upper-class households in 2017: 14%
Upper-class households in 2022: 26.1%
5-year change in upper-class households: 86.43%
Read More: The 7 Worst Things You Can Do If You Owe the IRS
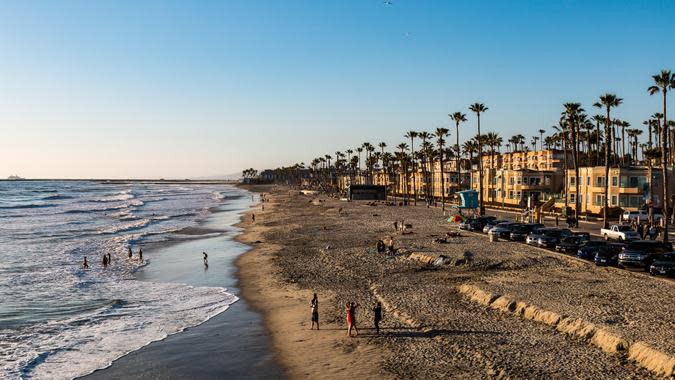
Oceanside, California
Total households in 2022: 61,636
Upper-class households in 2017: 12.9%
Upper-class households in 2022: 24%
5-year change in upper-class households: 86.05%
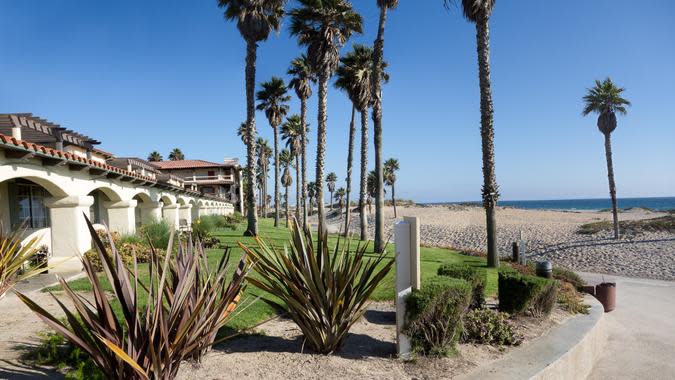
Oxnard, California
Total households in 2022: 51,099
Upper-class households in 2017:11.9%
Upper-class households in 2022: 22%
5-year change in upper-class households: 84.87%
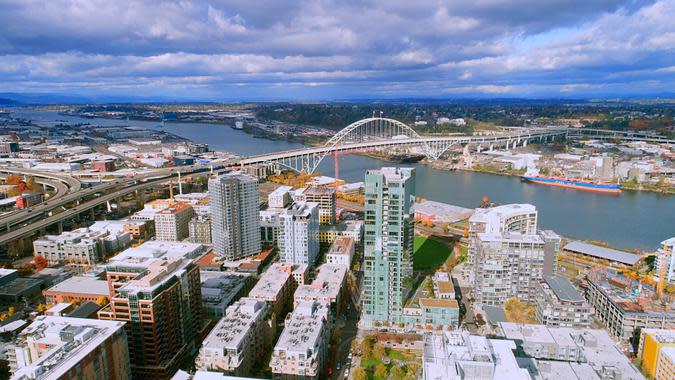
Portland, Oregon
Total households in 2022: 283,896
Upper-class households in 2017: 13.7%
Upper-class households in 2022: 25.3%
5-year change in upper-class households: 84.67%
Learn More: Trump-Era Tax Cuts Are Expiring — How Changes Will Impact Retirees
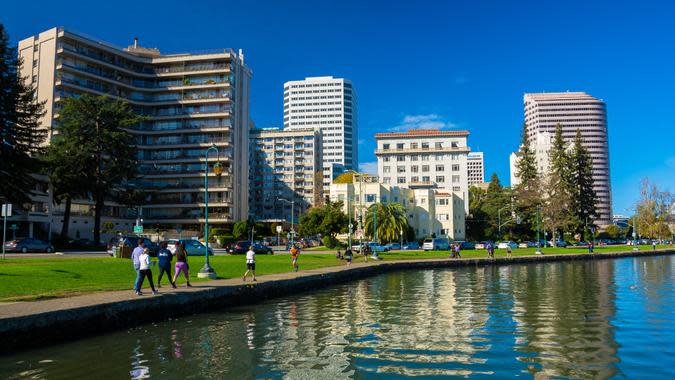
Oakland, California
Total households in 2022: 170,282
Upper-class households in 2017: 17.7%
Upper-class households in 2022: 32.5%
5-year change in upper-class households: 83.62%
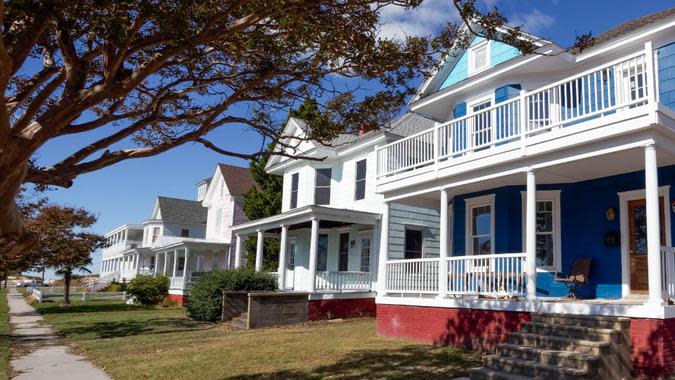
Chesapeake, Virginia
Total households in 2022: 91,368
Upper-class households in 2017: 13.9%
Upper-class households in 2022: 25.5%
5-year change in upper-class households: 83.45%
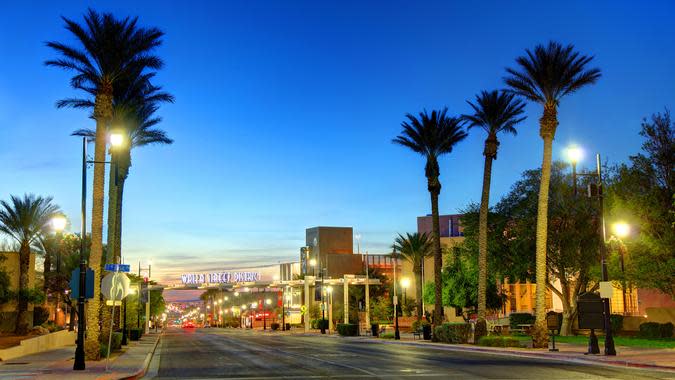
Henderson, Nevada
Total households in 2022: 124,626
Upper-class households in 2017: 13.2%
Upper-class households in 2022: 24.2%
5-year change in upper-class households: 83.33%
Discover More: IRS Increases Gift and Estate Tax Exempt Limits — Here’s How Much You Can Give Without Paying
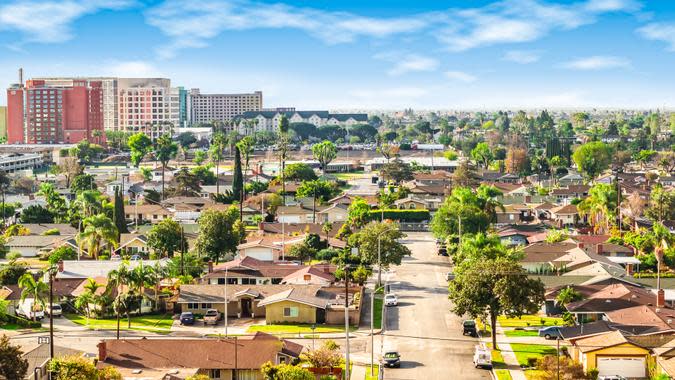
Anaheim, California
Total households in 2022:104,671
Upper-class households in 2017: 13.7%
Upper-class households in 2022: 25.1%
5-year change in upper-class households: 83.21%
Alexandria Bova contributed to the reporting for this article.
Methodology: GOBankingRates looked at all United States cities with above 40,000 households, as sourced from the 2022 American Community Survey, in order to find the 30 cities where the upper class has taken over. GOBankingRates found what percent of each city’s households in 2022 would be considered upper class (earning above $150,000). The cities that had a percentage of upper class households greater than or equal to the national average were moved on to the next round of analysis. Those cities were then ranked on 5-year change in percentage of upper class households (2017 – 2022). The 30 cities with the greatest change were included in the final rankings. This was the only ranking factor and all data was collected from the 2017 and 2022 American Community Surveys conducted by the United States Census Bureau. Supplemental data for each city was found on the 5-year change in households making $150,000-$199,999 and $200,000+. All data was compiled on and up to date as of June 7, 2024.
More From GOBankingRates
In Less Than a Decade, You Won't Be Able To Afford Homes in These 20 Arizona ZIP Codes
These 10 Used Cars Will Last Longer Than an Average New Vehicle
Trying to Build Your Savings? Make Sure Your Account Does These 6 Things
This article originally appeared on GOBankingRates.com: The Upper Class Has Taken Over These 30 Cities

 Yahoo Finance