
 Yahoo Finance
 UnitedHealth Group's (NYSE:UNH) Returns Have Hit A Wall
What trends should we look for it we want to identify stocks that can multiply in value over the long term? In a perfect world, we'd like to see a company investing more capital into its business and ideally the returns earned from that capital are also increasing. This shows us that it's a compounding machine, able to continually reinvest its earnings back into the business and generate higher returns. So, when we ran our eye over UnitedHealth Group's (NYSE:UNH) trend of ROCE, we liked what we saw.
What Is Return On Capital Employed (ROCE)?
For those who don't know, ROCE is a measure of a company's yearly pre-tax profit (its return), relative to the capital employed in the business. The formula for this calculation on UnitedHealth Group is:
Return on Capital Employed = Earnings Before Interest and Tax (EBIT) ÷ (Total Assets - Current Liabilities)
0.18 = US$32b ÷ (US$284b - US$104b) (Based on the trailing twelve months to March 2024).
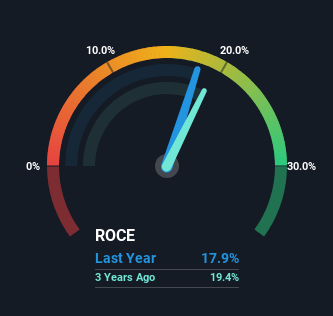
So, UnitedHealth Group has an ROCE of 18%. In absolute terms, that's a satisfactory return, but compared to the Healthcare industry average of 11% it's much better.
Check out our latest analysis for UnitedHealth Group
In the above chart we have measured UnitedHealth Group's prior ROCE against its prior performance, but the future is arguably more important. If you'd like to see what analysts are forecasting going forward, you should check out our free analyst report for UnitedHealth Group .
How Are Returns Trending?
The trend of ROCE doesn't stand out much, but returns on a whole are decent. Over the past five years, ROCE has remained relatively flat at around 18% and the business has deployed 76% more capital into its operations. 18% is a pretty standard return, and it provides some comfort knowing that UnitedHealth Group has consistently earned this amount. Stable returns in this ballpark can be unexciting, but if they can be maintained over the long run, they often provide nice rewards to shareholders.
The Bottom Line On UnitedHealth Group's ROCE
In the end, UnitedHealth Group has proven its ability to adequately reinvest capital at good rates of return. And the stock has done incredibly well with a 115% return over the last five years, so long term investors are no doubt ecstatic with that result. So while the positive underlying trends may be accounted for by investors, we still think this stock is worth looking into further.
If you'd like to know more about UnitedHealth Group, we've spotted 3 warning signs, and 1 of them makes us a bit uncomfortable.
If you want to search for solid companies with great earnings, check out this free list of companies with good balance sheets and impressive returns on equity.
Have feedback on this article? Concerned about the content? Get in touch with us directly. Alternatively, email editorial-team (at) simplywallst.com.
This article by Simply Wall St is general in nature. We provide commentary based on historical data and analyst forecasts only using an unbiased methodology and our articles are not intended to be financial advice. It does not constitute a recommendation to buy or sell any stock, and does not take account of your objectives, or your financial situation. We aim to bring you long-term focused analysis driven by fundamental data. Note that our analysis may not factor in the latest price-sensitive company announcements or qualitative material. Simply Wall St has no position in any stocks mentioned.
Have feedback on this article? Concerned about the content? Get in touch with us directly. Alternatively, email editorial-team@simplywallst.com
