
 Yahoo Finance
 We Like These Underlying Return On Capital Trends At Sarawak Plantation Berhad (KLSE:SWKPLNT)
To find a multi-bagger stock, what are the underlying trends we should look for in a business? Ideally, a business will show two trends; firstly a growing return on capital employed (ROCE) and secondly, an increasing amount of capital employed. This shows us that it's a compounding machine, able to continually reinvest its earnings back into the business and generate higher returns. Speaking of which, we noticed some great changes in Sarawak Plantation Berhad's (KLSE:SWKPLNT) returns on capital, so let's have a look.
What Is Return On Capital Employed (ROCE)?
Just to clarify if you're unsure, ROCE is a metric for evaluating how much pre-tax income (in percentage terms) a company earns on the capital invested in its business. To calculate this metric for Sarawak Plantation Berhad, this is the formula:
Return on Capital Employed = Earnings Before Interest and Tax (EBIT) ÷ (Total Assets - Current Liabilities)
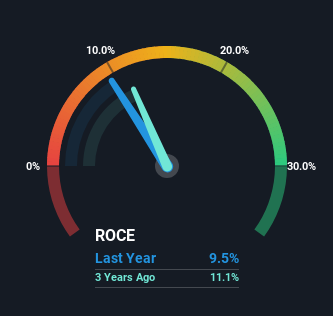
0.095 = RM83m ÷ (RM956m - RM81m) (Based on the trailing twelve months to December 2023).
Thus, Sarawak Plantation Berhad has an ROCE of 9.5%. In absolute terms, that's a low return, but it's much better than the Food industry average of 6.9%.
View our latest analysis for Sarawak Plantation Berhad
In the above chart we have measured Sarawak Plantation Berhad's prior ROCE against its prior performance, but the future is arguably more important. If you'd like to see what analysts are forecasting going forward, you should check out our free analyst report for Sarawak Plantation Berhad .
What The Trend Of ROCE Can Tell Us
Sarawak Plantation Berhad has not disappointed with their ROCE growth. Looking at the data, we can see that even though capital employed in the business has remained relatively flat, the ROCE generated has risen by 340% over the last five years. So our take on this is that the business has increased efficiencies to generate these higher returns, all the while not needing to make any additional investments. It's worth looking deeper into this though because while it's great that the business is more efficient, it might also mean that going forward the areas to invest internally for the organic growth are lacking.
The Key Takeaway
To sum it up, Sarawak Plantation Berhad is collecting higher returns from the same amount of capital, and that's impressive. Since the stock has returned a solid 88% to shareholders over the last five years, it's fair to say investors are beginning to recognize these changes. So given the stock has proven it has promising trends, it's worth researching the company further to see if these trends are likely to persist.
Sarawak Plantation Berhad does have some risks though, and we've spotted 1 warning sign for Sarawak Plantation Berhad that you might be interested in.
While Sarawak Plantation Berhad isn't earning the highest return, check out this free list of companies that are earning high returns on equity with solid balance sheets.
Have feedback on this article? Concerned about the content? Get in touch with us directly. Alternatively, email editorial-team (at) simplywallst.com.
This article by Simply Wall St is general in nature. We provide commentary based on historical data and analyst forecasts only using an unbiased methodology and our articles are not intended to be financial advice. It does not constitute a recommendation to buy or sell any stock, and does not take account of your objectives, or your financial situation. We aim to bring you long-term focused analysis driven by fundamental data. Note that our analysis may not factor in the latest price-sensitive company announcements or qualitative material. Simply Wall St has no position in any stocks mentioned.
