
 Yahoo Finance
 We Like These Underlying Return On Capital Trends At NFON (ETR:NFN)
If we want to find a stock that could multiply over the long term, what are the underlying trends we should look for? In a perfect world, we'd like to see a company investing more capital into its business and ideally the returns earned from that capital are also increasing. This shows us that it's a compounding machine, able to continually reinvest its earnings back into the business and generate higher returns. With that in mind, we've noticed some promising trends at NFON (ETR:NFN) so let's look a bit deeper.
Return On Capital Employed (ROCE): What Is It?
For those who don't know, ROCE is a measure of a company's yearly pre-tax profit (its return), relative to the capital employed in the business. To calculate this metric for NFON, this is the formula:
Return on Capital Employed = Earnings Before Interest and Tax (EBIT) ÷ (Total Assets - Current Liabilities)
0.0019 = €113k ÷ (€74m - €15m) (Based on the trailing twelve months to March 2024).
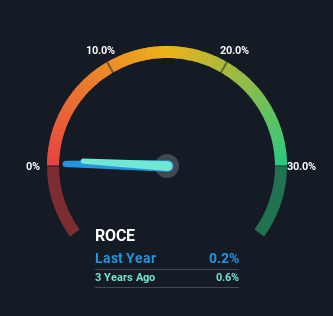
Thus, NFON has an ROCE of 0.2%. Ultimately, that's a low return and it under-performs the Telecom industry average of 6.6%.
See our latest analysis for NFON
In the above chart we have measured NFON's prior ROCE against its prior performance, but the future is arguably more important. If you're interested, you can view the analysts predictions in our free analyst report for NFON .
How Are Returns Trending?
The fact that NFON is now generating some pre-tax profits from its prior investments is very encouraging. The company was generating losses five years ago, but now it's earning 0.2% which is a sight for sore eyes. In addition to that, NFON is employing 20% more capital than previously which is expected of a company that's trying to break into profitability. We like this trend, because it tells us the company has profitable reinvestment opportunities available to it, and if it continues going forward that can lead to a multi-bagger performance.
The Bottom Line On NFON's ROCE
In summary, it's great to see that NFON has managed to break into profitability and is continuing to reinvest in its business. Given the stock has declined 50% in the last five years, this could be a good investment if the valuation and other metrics are also appealing. So researching this company further and determining whether or not these trends will continue seems justified.
On a separate note, we've found 1 warning sign for NFON you'll probably want to know about.
While NFON may not currently earn the highest returns, we've compiled a list of companies that currently earn more than 25% return on equity. Check out this free list here.
Have feedback on this article? Concerned about the content? Get in touch with us directly. Alternatively, email editorial-team (at) simplywallst.com.
This article by Simply Wall St is general in nature. We provide commentary based on historical data and analyst forecasts only using an unbiased methodology and our articles are not intended to be financial advice. It does not constitute a recommendation to buy or sell any stock, and does not take account of your objectives, or your financial situation. We aim to bring you long-term focused analysis driven by fundamental data. Note that our analysis may not factor in the latest price-sensitive company announcements or qualitative material. Simply Wall St has no position in any stocks mentioned.
