
 Yahoo Finance
 We Like These Underlying Return On Capital Trends At NetScout Systems (NASDAQ:NTCT)
There are a few key trends to look for if we want to identify the next multi-bagger. Amongst other things, we'll want to see two things; firstly, a growing return on capital employed (ROCE) and secondly, an expansion in the company's amount of capital employed. Basically this means that a company has profitable initiatives that it can continue to reinvest in, which is a trait of a compounding machine. So when we looked at NetScout Systems (NASDAQ:NTCT) and its trend of ROCE, we really liked what we saw.
Return On Capital Employed (ROCE): What Is It?
Just to clarify if you're unsure, ROCE is a metric for evaluating how much pre-tax income (in percentage terms) a company earns on the capital invested in its business. To calculate this metric for NetScout Systems, this is the formula:
Return on Capital Employed = Earnings Before Interest and Tax (EBIT) ÷ (Total Assets - Current Liabilities)
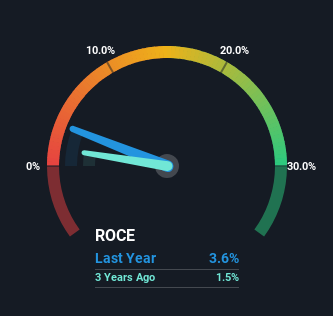
0.036 = US$84m ÷ (US$2.7b - US$359m) (Based on the trailing twelve months to September 2023).
So, NetScout Systems has an ROCE of 3.6%. In absolute terms, that's a low return and it also under-performs the Communications industry average of 8.3%.
View our latest analysis for NetScout Systems
Above you can see how the current ROCE for NetScout Systems compares to its prior returns on capital, but there's only so much you can tell from the past. If you'd like, you can check out the forecasts from the analysts covering NetScout Systems here for free.
How Are Returns Trending?
We're delighted to see that NetScout Systems is reaping rewards from its investments and has now broken into profitability. The company now earns 3.6% on its capital, because five years ago it was incurring losses. While returns have increased, the amount of capital employed by NetScout Systems has remained flat over the period. That being said, while an increase in efficiency is no doubt appealing, it'd be helpful to know if the company does have any investment plans going forward. After all, a company can only become a long term multi-bagger if it continually reinvests in itself at high rates of return.
What We Can Learn From NetScout Systems' ROCE
In summary, we're delighted to see that NetScout Systems has been able to increase efficiencies and earn higher rates of return on the same amount of capital. Since the total return from the stock has been almost flat over the last five years, there might be an opportunity here if the valuation looks good. That being the case, research into the company's current valuation metrics and future prospects seems fitting.
Before jumping to any conclusions though, we need to know what value we're getting for the current share price. That's where you can check out our FREE intrinsic value estimation that compares the share price and estimated value.
For those who like to invest in solid companies, check out this free list of companies with solid balance sheets and high returns on equity.
Have feedback on this article? Concerned about the content? Get in touch with us directly. Alternatively, email editorial-team (at) simplywallst.com.
This article by Simply Wall St is general in nature. We provide commentary based on historical data and analyst forecasts only using an unbiased methodology and our articles are not intended to be financial advice. It does not constitute a recommendation to buy or sell any stock, and does not take account of your objectives, or your financial situation. We aim to bring you long-term focused analysis driven by fundamental data. Note that our analysis may not factor in the latest price-sensitive company announcements or qualitative material. Simply Wall St has no position in any stocks mentioned.
