
 Yahoo Finance
 We Like These Underlying Return On Capital Trends At LB Aluminium Berhad (KLSE:LBALUM)
If you're not sure where to start when looking for the next multi-bagger, there are a few key trends you should keep an eye out for. One common approach is to try and find a company with returns on capital employed (ROCE) that are increasing, in conjunction with a growing amount of capital employed. This shows us that it's a compounding machine, able to continually reinvest its earnings back into the business and generate higher returns. So on that note, LB Aluminium Berhad (KLSE:LBALUM) looks quite promising in regards to its trends of return on capital.
Return On Capital Employed (ROCE): What Is It?
If you haven't worked with ROCE before, it measures the 'return' (pre-tax profit) a company generates from capital employed in its business. Analysts use this formula to calculate it for LB Aluminium Berhad:
Return on Capital Employed = Earnings Before Interest and Tax (EBIT) ÷ (Total Assets - Current Liabilities)
0.069 = RM37m ÷ (RM833m - RM296m) (Based on the trailing twelve months to October 2023).
Therefore, LB Aluminium Berhad has an ROCE of 6.9%. In absolute terms, that's a low return but it's around the Metals and Mining industry average of 5.8%.
Check out our latest analysis for LB Aluminium Berhad
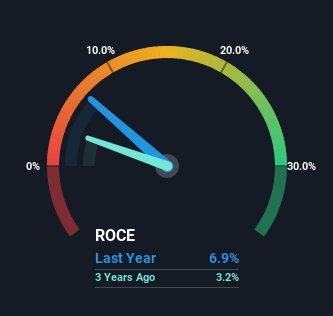
Historical performance is a great place to start when researching a stock so above you can see the gauge for LB Aluminium Berhad's ROCE against it's prior returns. If you'd like to look at how LB Aluminium Berhad has performed in the past in other metrics, you can view this free graph of LB Aluminium Berhad's past earnings, revenue and cash flow.
So How Is LB Aluminium Berhad's ROCE Trending?
We're glad to see that ROCE is heading in the right direction, even if it is still low at the moment. Over the last five years, returns on capital employed have risen substantially to 6.9%. Basically the business is earning more per dollar of capital invested and in addition to that, 68% more capital is being employed now too. This can indicate that there's plenty of opportunities to invest capital internally and at ever higher rates, a combination that's common among multi-baggers.
In Conclusion...
A company that is growing its returns on capital and can consistently reinvest in itself is a highly sought after trait, and that's what LB Aluminium Berhad has. And investors seem to expect more of this going forward, since the stock has rewarded shareholders with a 98% return over the last five years. Therefore, we think it would be worth your time to check if these trends are going to continue.
On a final note, we've found 4 warning signs for LB Aluminium Berhad that we think you should be aware of.
If you want to search for solid companies with great earnings, check out this free list of companies with good balance sheets and impressive returns on equity.
Have feedback on this article? Concerned about the content? Get in touch with us directly. Alternatively, email editorial-team (at) simplywallst.com.
This article by Simply Wall St is general in nature. We provide commentary based on historical data and analyst forecasts only using an unbiased methodology and our articles are not intended to be financial advice. It does not constitute a recommendation to buy or sell any stock, and does not take account of your objectives, or your financial situation. We aim to bring you long-term focused analysis driven by fundamental data. Note that our analysis may not factor in the latest price-sensitive company announcements or qualitative material. Simply Wall St has no position in any stocks mentioned.
