
 Yahoo Finance
 We Like These Underlying Return On Capital Trends At Fugro (AMS:FUR)
If we want to find a potential multi-bagger, often there are underlying trends that can provide clues. Firstly, we'll want to see a proven return on capital employed (ROCE) that is increasing, and secondly, an expanding base of capital employed. If you see this, it typically means it's a company with a great business model and plenty of profitable reinvestment opportunities. Speaking of which, we noticed some great changes in Fugro's (AMS:FUR) returns on capital, so let's have a look.
Understanding Return On Capital Employed (ROCE)
For those that aren't sure what ROCE is, it measures the amount of pre-tax profits a company can generate from the capital employed in its business. Analysts use this formula to calculate it for Fugro:
Return on Capital Employed = Earnings Before Interest and Tax (EBIT) ÷ (Total Assets - Current Liabilities)
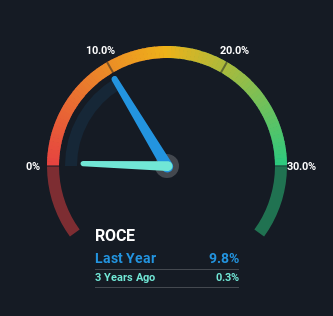
0.098 = €153m ÷ (€2.2b - €624m) (Based on the trailing twelve months to June 2023).
Therefore, Fugro has an ROCE of 9.8%. Even though it's in line with the industry average of 10%, it's still a low return by itself.
See our latest analysis for Fugro
Above you can see how the current ROCE for Fugro compares to its prior returns on capital, but there's only so much you can tell from the past. If you'd like, you can check out the forecasts from the analysts covering Fugro here for free.
What Can We Tell From Fugro's ROCE Trend?
Fugro has not disappointed with their ROCE growth. The figures show that over the last five years, ROCE has grown 1,725% whilst employing roughly the same amount of capital. So our take on this is that the business has increased efficiencies to generate these higher returns, all the while not needing to make any additional investments. The company is doing well in that sense, and it's worth investigating what the management team has planned for long term growth prospects.
The Key Takeaway
To sum it up, Fugro is collecting higher returns from the same amount of capital, and that's impressive. And investors seem to expect more of this going forward, since the stock has rewarded shareholders with a 30% return over the last year. In light of that, we think it's worth looking further into this stock because if Fugro can keep these trends up, it could have a bright future ahead.
Before jumping to any conclusions though, we need to know what value we're getting for the current share price. That's where you can check out our FREE intrinsic value estimation that compares the share price and estimated value.
While Fugro may not currently earn the highest returns, we've compiled a list of companies that currently earn more than 25% return on equity. Check out this free list here.
Have feedback on this article? Concerned about the content? Get in touch with us directly. Alternatively, email editorial-team (at) simplywallst.com.
This article by Simply Wall St is general in nature. We provide commentary based on historical data and analyst forecasts only using an unbiased methodology and our articles are not intended to be financial advice. It does not constitute a recommendation to buy or sell any stock, and does not take account of your objectives, or your financial situation. We aim to bring you long-term focused analysis driven by fundamental data. Note that our analysis may not factor in the latest price-sensitive company announcements or qualitative material. Simply Wall St has no position in any stocks mentioned.
