
 Yahoo Finance
 We Like These Underlying Return On Capital Trends At Enterprise Group (TSE:E)
Did you know there are some financial metrics that can provide clues of a potential multi-bagger? Ideally, a business will show two trends; firstly a growing return on capital employed (ROCE) and secondly, an increasing amount of capital employed. Basically this means that a company has profitable initiatives that it can continue to reinvest in, which is a trait of a compounding machine. Speaking of which, we noticed some great changes in Enterprise Group's (TSE:E) returns on capital, so let's have a look.
What Is Return On Capital Employed (ROCE)?
For those that aren't sure what ROCE is, it measures the amount of pre-tax profits a company can generate from the capital employed in its business. To calculate this metric for Enterprise Group, this is the formula:
Return on Capital Employed = Earnings Before Interest and Tax (EBIT) ÷ (Total Assets - Current Liabilities)
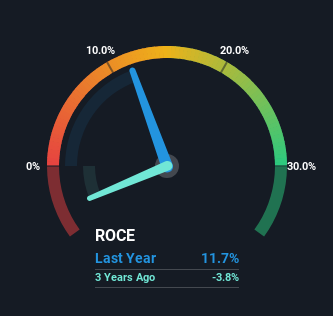
0.12 = CA$9.5m ÷ (CA$87m - CA$5.6m) (Based on the trailing twelve months to March 2024).
Therefore, Enterprise Group has an ROCE of 12%. In absolute terms, that's a pretty normal return, and it's somewhat close to the Trade Distributors industry average of 14%.
View our latest analysis for Enterprise Group
In the above chart we have measured Enterprise Group's prior ROCE against its prior performance, but the future is arguably more important. If you'd like to see what analysts are forecasting going forward, you should check out our free analyst report for Enterprise Group .
How Are Returns Trending?
We're delighted to see that Enterprise Group is reaping rewards from its investments and is now generating some pre-tax profits. The company was generating losses five years ago, but now it's earning 12% which is a sight for sore eyes. And unsurprisingly, like most companies trying to break into the black, Enterprise Group is utilizing 36% more capital than it was five years ago. This can tell us that the company has plenty of reinvestment opportunities that are able to generate higher returns.
The Bottom Line On Enterprise Group's ROCE
In summary, it's great to see that Enterprise Group has managed to break into profitability and is continuing to reinvest in its business. And with the stock having performed exceptionally well over the last five years, these patterns are being accounted for by investors. With that being said, we still think the promising fundamentals mean the company deserves some further due diligence.
If you want to know some of the risks facing Enterprise Group we've found 3 warning signs (1 shouldn't be ignored!) that you should be aware of before investing here.
For those who like to invest in solid companies, check out this free list of companies with solid balance sheets and high returns on equity.
Have feedback on this article? Concerned about the content? Get in touch with us directly. Alternatively, email editorial-team (at) simplywallst.com.
This article by Simply Wall St is general in nature. We provide commentary based on historical data and analyst forecasts only using an unbiased methodology and our articles are not intended to be financial advice. It does not constitute a recommendation to buy or sell any stock, and does not take account of your objectives, or your financial situation. We aim to bring you long-term focused analysis driven by fundamental data. Note that our analysis may not factor in the latest price-sensitive company announcements or qualitative material. Simply Wall St has no position in any stocks mentioned.
Have feedback on this article? Concerned about the content? Get in touch with us directly. Alternatively, email editorial-team@simplywallst.com
