
 Yahoo Finance
 Under The Bonnet, W.W. Grainger's (NYSE:GWW) Returns Look Impressive
If we want to find a potential multi-bagger, often there are underlying trends that can provide clues. Typically, we'll want to notice a trend of growing return on capital employed (ROCE) and alongside that, an expanding base of capital employed. This shows us that it's a compounding machine, able to continually reinvest its earnings back into the business and generate higher returns. With that in mind, the ROCE of W.W. Grainger (NYSE:GWW) looks great, so lets see what the trend can tell us.
Understanding Return On Capital Employed (ROCE)
If you haven't worked with ROCE before, it measures the 'return' (pre-tax profit) a company generates from capital employed in its business. Analysts use this formula to calculate it for W.W. Grainger:
Return on Capital Employed = Earnings Before Interest and Tax (EBIT) ÷ (Total Assets - Current Liabilities)
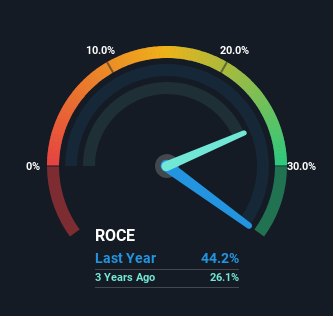
0.44 = US$2.6b ÷ (US$8.4b - US$2.5b) (Based on the trailing twelve months to March 2024).
Therefore, W.W. Grainger has an ROCE of 44%. In absolute terms that's a great return and it's even better than the Trade Distributors industry average of 13%.
See our latest analysis for W.W. Grainger
Above you can see how the current ROCE for W.W. Grainger compares to its prior returns on capital, but there's only so much you can tell from the past. If you'd like to see what analysts are forecasting going forward, you should check out our free analyst report for W.W. Grainger .
What Does the ROCE Trend For W.W. Grainger Tell Us?
Investors would be pleased with what's happening at W.W. Grainger. The numbers show that in the last five years, the returns generated on capital employed have grown considerably to 44%. Basically the business is earning more per dollar of capital invested and in addition to that, 29% more capital is being employed now too. So we're very much inspired by what we're seeing at W.W. Grainger thanks to its ability to profitably reinvest capital.
The Key Takeaway
A company that is growing its returns on capital and can consistently reinvest in itself is a highly sought after trait, and that's what W.W. Grainger has. And a remarkable 251% total return over the last five years tells us that investors are expecting more good things to come in the future. With that being said, we still think the promising fundamentals mean the company deserves some further due diligence.
One more thing to note, we've identified 1 warning sign with W.W. Grainger and understanding it should be part of your investment process.
W.W. Grainger is not the only stock earning high returns. If you'd like to see more, check out our free list of companies earning high returns on equity with solid fundamentals.
Have feedback on this article? Concerned about the content? Get in touch with us directly. Alternatively, email editorial-team (at) simplywallst.com.
This article by Simply Wall St is general in nature. We provide commentary based on historical data and analyst forecasts only using an unbiased methodology and our articles are not intended to be financial advice. It does not constitute a recommendation to buy or sell any stock, and does not take account of your objectives, or your financial situation. We aim to bring you long-term focused analysis driven by fundamental data. Note that our analysis may not factor in the latest price-sensitive company announcements or qualitative material. Simply Wall St has no position in any stocks mentioned.
