
 Yahoo Finance
 Under The Bonnet, Bucher Industries' (VTX:BUCN) Returns Look Impressive
If we want to find a potential multi-bagger, often there are underlying trends that can provide clues. Firstly, we'd want to identify a growing return on capital employed (ROCE) and then alongside that, an ever-increasing base of capital employed. Ultimately, this demonstrates that it's a business that is reinvesting profits at increasing rates of return. So when we looked at the ROCE trend of Bucher Industries (VTX:BUCN) we really liked what we saw.
Understanding Return On Capital Employed (ROCE)
Just to clarify if you're unsure, ROCE is a metric for evaluating how much pre-tax income (in percentage terms) a company earns on the capital invested in its business. Analysts use this formula to calculate it for Bucher Industries:
Return on Capital Employed = Earnings Before Interest and Tax (EBIT) ÷ (Total Assets - Current Liabilities)
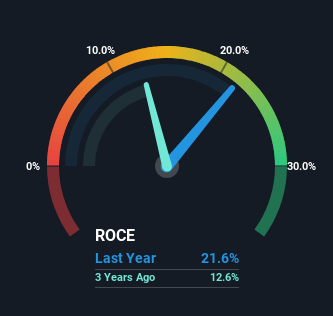
0.22 = CHF414m ÷ (CHF3.0b - CHF1.0b) (Based on the trailing twelve months to December 2023).
Therefore, Bucher Industries has an ROCE of 22%. That's a fantastic return and not only that, it outpaces the average of 15% earned by companies in a similar industry.
See our latest analysis for Bucher Industries
In the above chart we have measured Bucher Industries' prior ROCE against its prior performance, but the future is arguably more important. If you'd like to see what analysts are forecasting going forward, you should check out our free analyst report for Bucher Industries .
So How Is Bucher Industries' ROCE Trending?
Bucher Industries is showing promise given that its ROCE is trending up and to the right. Looking at the data, we can see that even though capital employed in the business has remained relatively flat, the ROCE generated has risen by 21% over the last five years. So it's likely that the business is now reaping the full benefits of its past investments, since the capital employed hasn't changed considerably. The company is doing well in that sense, and it's worth investigating what the management team has planned for long term growth prospects.
The Bottom Line
As discussed above, Bucher Industries appears to be getting more proficient at generating returns since capital employed has remained flat but earnings (before interest and tax) are up. Since the stock has only returned 29% to shareholders over the last five years, the promising fundamentals may not be recognized yet by investors. So with that in mind, we think the stock deserves further research.
Since virtually every company faces some risks, it's worth knowing what they are, and we've spotted 2 warning signs for Bucher Industries (of which 1 can't be ignored!) that you should know about.
If you'd like to see other companies earning high returns, check out our free list of companies earning high returns with solid balance sheets here.
Have feedback on this article? Concerned about the content? Get in touch with us directly. Alternatively, email editorial-team (at) simplywallst.com.
This article by Simply Wall St is general in nature. We provide commentary based on historical data and analyst forecasts only using an unbiased methodology and our articles are not intended to be financial advice. It does not constitute a recommendation to buy or sell any stock, and does not take account of your objectives, or your financial situation. We aim to bring you long-term focused analysis driven by fundamental data. Note that our analysis may not factor in the latest price-sensitive company announcements or qualitative material. Simply Wall St has no position in any stocks mentioned.
