
 Yahoo Finance
 Under Armour (NYSE:UAA) Hasn't Managed To Accelerate Its Returns
If you're not sure where to start when looking for the next multi-bagger, there are a few key trends you should keep an eye out for. Ideally, a business will show two trends; firstly a growing return on capital employed (ROCE) and secondly, an increasing amount of capital employed. Put simply, these types of businesses are compounding machines, meaning they are continually reinvesting their earnings at ever-higher rates of return. In light of that, when we looked at Under Armour (NYSE:UAA) and its ROCE trend, we weren't exactly thrilled.
What Is Return On Capital Employed (ROCE)?
If you haven't worked with ROCE before, it measures the 'return' (pre-tax profit) a company generates from capital employed in its business. The formula for this calculation on Under Armour is:
Return on Capital Employed = Earnings Before Interest and Tax (EBIT) ÷ (Total Assets - Current Liabilities)
0.066 = US$236m ÷ (US$4.8b - US$1.2b) (Based on the trailing twelve months to March 2024).
So, Under Armour has an ROCE of 6.6%. In absolute terms, that's a low return and it also under-performs the Luxury industry average of 12%.
See our latest analysis for Under Armour
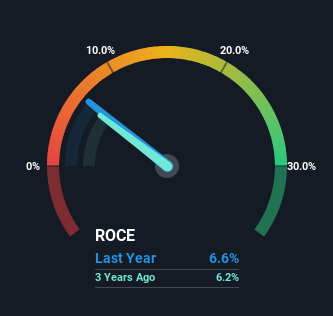
Above you can see how the current ROCE for Under Armour compares to its prior returns on capital, but there's only so much you can tell from the past. If you'd like, you can check out the forecasts from the analysts covering Under Armour for free.
What Can We Tell From Under Armour's ROCE Trend?
There hasn't been much to report for Under Armour's returns and its level of capital employed because both metrics have been steady for the past five years. This tells us the company isn't reinvesting in itself, so it's plausible that it's past the growth phase. So unless we see a substantial change at Under Armour in terms of ROCE and additional investments being made, we wouldn't hold our breath on it being a multi-bagger.
The Key Takeaway
In summary, Under Armour isn't compounding its earnings but is generating stable returns on the same amount of capital employed. Moreover, since the stock has crumbled 72% over the last five years, it appears investors are expecting the worst. Therefore based on the analysis done in this article, we don't think Under Armour has the makings of a multi-bagger.
One more thing to note, we've identified 1 warning sign with Under Armour and understanding it should be part of your investment process.
While Under Armour may not currently earn the highest returns, we've compiled a list of companies that currently earn more than 25% return on equity. Check out this free list here.
Have feedback on this article? Concerned about the content? Get in touch with us directly. Alternatively, email editorial-team (at) simplywallst.com.
This article by Simply Wall St is general in nature. We provide commentary based on historical data and analyst forecasts only using an unbiased methodology and our articles are not intended to be financial advice. It does not constitute a recommendation to buy or sell any stock, and does not take account of your objectives, or your financial situation. We aim to bring you long-term focused analysis driven by fundamental data. Note that our analysis may not factor in the latest price-sensitive company announcements or qualitative material. Simply Wall St has no position in any stocks mentioned.
Have feedback on this article? Concerned about the content? Get in touch with us directly. Alternatively, email editorial-team@simplywallst.com
