
 Yahoo Finance
 Tung Lok Restaurants (2000) (Catalist:540) Is Experiencing Growth In Returns On Capital
There are a few key trends to look for if we want to identify the next multi-bagger. In a perfect world, we'd like to see a company investing more capital into its business and ideally the returns earned from that capital are also increasing. Basically this means that a company has profitable initiatives that it can continue to reinvest in, which is a trait of a compounding machine. So on that note, Tung Lok Restaurants (2000) (Catalist:540) looks quite promising in regards to its trends of return on capital.
Return On Capital Employed (ROCE): What Is It?
For those who don't know, ROCE is a measure of a company's yearly pre-tax profit (its return), relative to the capital employed in the business. The formula for this calculation on Tung Lok Restaurants (2000) is:
Return on Capital Employed = Earnings Before Interest and Tax (EBIT) ÷ (Total Assets - Current Liabilities)
0.14 = S$4.9m ÷ (S$54m - S$18m) (Based on the trailing twelve months to September 2023).
Thus, Tung Lok Restaurants (2000) has an ROCE of 14%. On its own, that's a standard return, however it's much better than the 4.1% generated by the Hospitality industry.
See our latest analysis for Tung Lok Restaurants (2000)
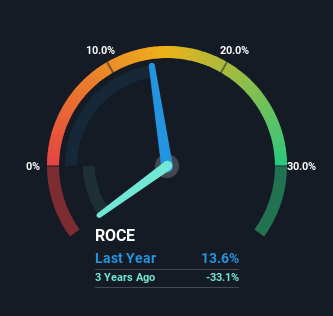
Historical performance is a great place to start when researching a stock so above you can see the gauge for Tung Lok Restaurants (2000)'s ROCE against it's prior returns. If you'd like to look at how Tung Lok Restaurants (2000) has performed in the past in other metrics, you can view this free graph of Tung Lok Restaurants (2000)'s past earnings, revenue and cash flow.
So How Is Tung Lok Restaurants (2000)'s ROCE Trending?
Tung Lok Restaurants (2000) is displaying some positive trends. The numbers show that in the last five years, the returns generated on capital employed have grown considerably to 14%. The company is effectively making more money per dollar of capital used, and it's worth noting that the amount of capital has increased too, by 84%. This can indicate that there's plenty of opportunities to invest capital internally and at ever higher rates, a combination that's common among multi-baggers.
Our Take On Tung Lok Restaurants (2000)'s ROCE
In summary, it's great to see that Tung Lok Restaurants (2000) can compound returns by consistently reinvesting capital at increasing rates of return, because these are some of the key ingredients of those highly sought after multi-baggers. And since the stock has fallen 39% over the last five years, there might be an opportunity here. With that in mind, we believe the promising trends warrant this stock for further investigation.
If you'd like to know about the risks facing Tung Lok Restaurants (2000), we've discovered 2 warning signs that you should be aware of.
If you want to search for solid companies with great earnings, check out this free list of companies with good balance sheets and impressive returns on equity.
Have feedback on this article? Concerned about the content? Get in touch with us directly. Alternatively, email editorial-team (at) simplywallst.com.
This article by Simply Wall St is general in nature. We provide commentary based on historical data and analyst forecasts only using an unbiased methodology and our articles are not intended to be financial advice. It does not constitute a recommendation to buy or sell any stock, and does not take account of your objectives, or your financial situation. We aim to bring you long-term focused analysis driven by fundamental data. Note that our analysis may not factor in the latest price-sensitive company announcements or qualitative material. Simply Wall St has no position in any stocks mentioned.
