
 Yahoo Finance
 The Trend Of High Returns At Alphabet (NASDAQ:GOOGL) Has Us Very Interested
If you're looking for a multi-bagger, there's a few things to keep an eye out for. Firstly, we'd want to identify a growing return on capital employed (ROCE) and then alongside that, an ever-increasing base of capital employed. Ultimately, this demonstrates that it's a business that is reinvesting profits at increasing rates of return. So when we looked at the ROCE trend of Alphabet (NASDAQ:GOOGL) we really liked what we saw.
Return On Capital Employed (ROCE): What Is It?
For those that aren't sure what ROCE is, it measures the amount of pre-tax profits a company can generate from the capital employed in its business. To calculate this metric for Alphabet, this is the formula:
Return on Capital Employed = Earnings Before Interest and Tax (EBIT) ÷ (Total Assets - Current Liabilities)
0.29 = US$97b ÷ (US$407b - US$77b) (Based on the trailing twelve months to March 2024).
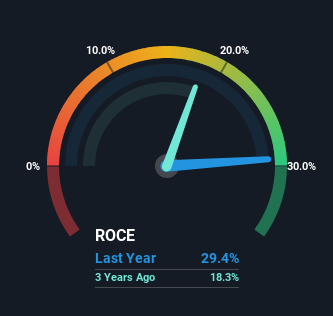
Thus, Alphabet has an ROCE of 29%. That's a fantastic return and not only that, it outpaces the average of 6.4% earned by companies in a similar industry.
See our latest analysis for Alphabet
Above you can see how the current ROCE for Alphabet compares to its prior returns on capital, but there's only so much you can tell from the past. If you'd like to see what analysts are forecasting going forward, you should check out our free analyst report for Alphabet .
What The Trend Of ROCE Can Tell Us
The trends we've noticed at Alphabet are quite reassuring. The numbers show that in the last five years, the returns generated on capital employed have grown considerably to 29%. The company is effectively making more money per dollar of capital used, and it's worth noting that the amount of capital has increased too, by 57%. This can indicate that there's plenty of opportunities to invest capital internally and at ever higher rates, a combination that's common among multi-baggers.
Our Take On Alphabet's ROCE
All in all, it's terrific to see that Alphabet is reaping the rewards from prior investments and is growing its capital base. And a remarkable 228% total return over the last five years tells us that investors are expecting more good things to come in the future. Therefore, we think it would be worth your time to check if these trends are going to continue.
Before jumping to any conclusions though, we need to know what value we're getting for the current share price. That's where you can check out our FREE intrinsic value estimation for GOOGL that compares the share price and estimated value.
High returns are a key ingredient to strong performance, so check out our free list ofstocks earning high returns on equity with solid balance sheets.
Have feedback on this article? Concerned about the content? Get in touch with us directly. Alternatively, email editorial-team (at) simplywallst.com.
This article by Simply Wall St is general in nature. We provide commentary based on historical data and analyst forecasts only using an unbiased methodology and our articles are not intended to be financial advice. It does not constitute a recommendation to buy or sell any stock, and does not take account of your objectives, or your financial situation. We aim to bring you long-term focused analysis driven by fundamental data. Note that our analysis may not factor in the latest price-sensitive company announcements or qualitative material. Simply Wall St has no position in any stocks mentioned.
Have feedback on this article? Concerned about the content? Get in touch with us directly. Alternatively, email editorial-team@simplywallst.com
