
 Yahoo Finance
 TRC Synergy Berhad (KLSE:TRC) May Have Issues Allocating Its Capital
If you're not sure where to start when looking for the next multi-bagger, there are a few key trends you should keep an eye out for. Amongst other things, we'll want to see two things; firstly, a growing return on capital employed (ROCE) and secondly, an expansion in the company's amount of capital employed. Put simply, these types of businesses are compounding machines, meaning they are continually reinvesting their earnings at ever-higher rates of return. In light of that, when we looked at TRC Synergy Berhad (KLSE:TRC) and its ROCE trend, we weren't exactly thrilled.
Understanding Return On Capital Employed (ROCE)
Just to clarify if you're unsure, ROCE is a metric for evaluating how much pre-tax income (in percentage terms) a company earns on the capital invested in its business. To calculate this metric for TRC Synergy Berhad, this is the formula:
Return on Capital Employed = Earnings Before Interest and Tax (EBIT) ÷ (Total Assets - Current Liabilities)
0.015 = RM10m ÷ (RM946m - RM274m) (Based on the trailing twelve months to March 2024).
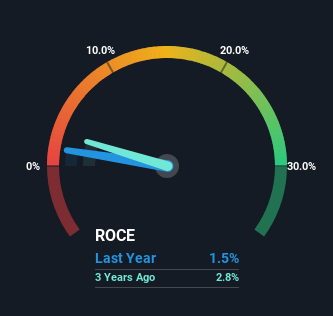
Thus, TRC Synergy Berhad has an ROCE of 1.5%. In absolute terms, that's a low return and it also under-performs the Construction industry average of 7.7%.
View our latest analysis for TRC Synergy Berhad
In the above chart we have measured TRC Synergy Berhad's prior ROCE against its prior performance, but the future is arguably more important. If you're interested, you can view the analysts predictions in our free analyst report for TRC Synergy Berhad .
The Trend Of ROCE
In terms of TRC Synergy Berhad's historical ROCE movements, the trend isn't fantastic. Over the last five years, returns on capital have decreased to 1.5% from 8.6% five years ago. On the other hand, the company has been employing more capital without a corresponding improvement in sales in the last year, which could suggest these investments are longer term plays. It's worth keeping an eye on the company's earnings from here on to see if these investments do end up contributing to the bottom line.
On a related note, TRC Synergy Berhad has decreased its current liabilities to 29% of total assets. That could partly explain why the ROCE has dropped. Effectively this means their suppliers or short-term creditors are funding less of the business, which reduces some elements of risk. Since the business is basically funding more of its operations with it's own money, you could argue this has made the business less efficient at generating ROCE.
In Conclusion...
In summary, TRC Synergy Berhad is reinvesting funds back into the business for growth but unfortunately it looks like sales haven't increased much just yet. Since the stock has declined 15% over the last five years, investors may not be too optimistic on this trend improving either. All in all, the inherent trends aren't typical of multi-baggers, so if that's what you're after, we think you might have more luck elsewhere.
If you want to know some of the risks facing TRC Synergy Berhad we've found 4 warning signs (1 doesn't sit too well with us!) that you should be aware of before investing here.
For those who like to invest in solid companies, check out this free list of companies with solid balance sheets and high returns on equity.
Have feedback on this article? Concerned about the content? Get in touch with us directly. Alternatively, email editorial-team (at) simplywallst.com.
This article by Simply Wall St is general in nature. We provide commentary based on historical data and analyst forecasts only using an unbiased methodology and our articles are not intended to be financial advice. It does not constitute a recommendation to buy or sell any stock, and does not take account of your objectives, or your financial situation. We aim to bring you long-term focused analysis driven by fundamental data. Note that our analysis may not factor in the latest price-sensitive company announcements or qualitative material. Simply Wall St has no position in any stocks mentioned.
Have feedback on this article? Concerned about the content? Get in touch with us directly. Alternatively, email editorial-team@simplywallst.com
