
 Yahoo Finance
 TMC Life Sciences Berhad (KLSE:TMCLIFE) Is Looking To Continue Growing Its Returns On Capital
There are a few key trends to look for if we want to identify the next multi-bagger. Firstly, we'd want to identify a growing return on capital employed (ROCE) and then alongside that, an ever-increasing base of capital employed. Put simply, these types of businesses are compounding machines, meaning they are continually reinvesting their earnings at ever-higher rates of return. So when we looked at TMC Life Sciences Berhad (KLSE:TMCLIFE) and its trend of ROCE, we really liked what we saw.
Understanding Return On Capital Employed (ROCE)
For those that aren't sure what ROCE is, it measures the amount of pre-tax profits a company can generate from the capital employed in its business. To calculate this metric for TMC Life Sciences Berhad, this is the formula:
Return on Capital Employed = Earnings Before Interest and Tax (EBIT) ÷ (Total Assets - Current Liabilities)
0.064 = RM70m ÷ (RM1.2b - RM97m) (Based on the trailing twelve months to March 2024).
Thus, TMC Life Sciences Berhad has an ROCE of 6.4%. Ultimately, that's a low return and it under-performs the Healthcare industry average of 9.7%.
Check out our latest analysis for TMC Life Sciences Berhad
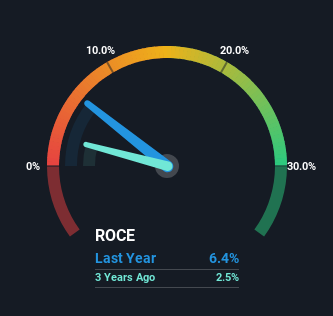
Historical performance is a great place to start when researching a stock so above you can see the gauge for TMC Life Sciences Berhad's ROCE against it's prior returns. If you want to delve into the historical earnings , check out these free graphs detailing revenue and cash flow performance of TMC Life Sciences Berhad.
What Can We Tell From TMC Life Sciences Berhad's ROCE Trend?
Even though ROCE is still low in absolute terms, it's good to see it's heading in the right direction. The numbers show that in the last five years, the returns generated on capital employed have grown considerably to 6.4%. The company is effectively making more money per dollar of capital used, and it's worth noting that the amount of capital has increased too, by 43%. So we're very much inspired by what we're seeing at TMC Life Sciences Berhad thanks to its ability to profitably reinvest capital.
What We Can Learn From TMC Life Sciences Berhad's ROCE
In summary, it's great to see that TMC Life Sciences Berhad can compound returns by consistently reinvesting capital at increasing rates of return, because these are some of the key ingredients of those highly sought after multi-baggers. Since the total return from the stock has been almost flat over the last five years, there might be an opportunity here if the valuation looks good. With that in mind, we believe the promising trends warrant this stock for further investigation.
Before jumping to any conclusions though, we need to know what value we're getting for the current share price. That's where you can check out our FREE intrinsic value estimation for TMCLIFE that compares the share price and estimated value.
While TMC Life Sciences Berhad may not currently earn the highest returns, we've compiled a list of companies that currently earn more than 25% return on equity. Check out this free list here.
Have feedback on this article? Concerned about the content? Get in touch with us directly. Alternatively, email editorial-team (at) simplywallst.com.
This article by Simply Wall St is general in nature. We provide commentary based on historical data and analyst forecasts only using an unbiased methodology and our articles are not intended to be financial advice. It does not constitute a recommendation to buy or sell any stock, and does not take account of your objectives, or your financial situation. We aim to bring you long-term focused analysis driven by fundamental data. Note that our analysis may not factor in the latest price-sensitive company announcements or qualitative material. Simply Wall St has no position in any stocks mentioned.
