
 Yahoo Finance
 Those who invested in Hong Leong Finance (SGX:S41) five years ago are up 16%
These days it's easy to simply buy an index fund, and your returns should (roughly) match the market. A talented investor can beat the market with a diversified portfolio, but even then, some stocks will under-perform. The Hong Leong Finance Limited (SGX:S41) stock price is down 11% over five years, but the total shareholder return is 16% once you include the dividend. That's better than the market which declined 1.0% over the same time.
It's worthwhile assessing if the company's economics have been moving in lockstep with these underwhelming shareholder returns, or if there is some disparity between the two. So let's do just that.
View our latest analysis for Hong Leong Finance
To quote Buffett, 'Ships will sail around the world but the Flat Earth Society will flourish. There will continue to be wide discrepancies between price and value in the marketplace...' One flawed but reasonable way to assess how sentiment around a company has changed is to compare the earnings per share (EPS) with the share price.
Looking back five years, both Hong Leong Finance's share price and EPS declined; the latter at a rate of 4.8% per year. The share price decline of 2% per year isn't as bad as the EPS decline. So investors might expect EPS to bounce back -- or they may have previously foreseen the EPS decline.
The graphic below depicts how EPS has changed over time (unveil the exact values by clicking on the image).
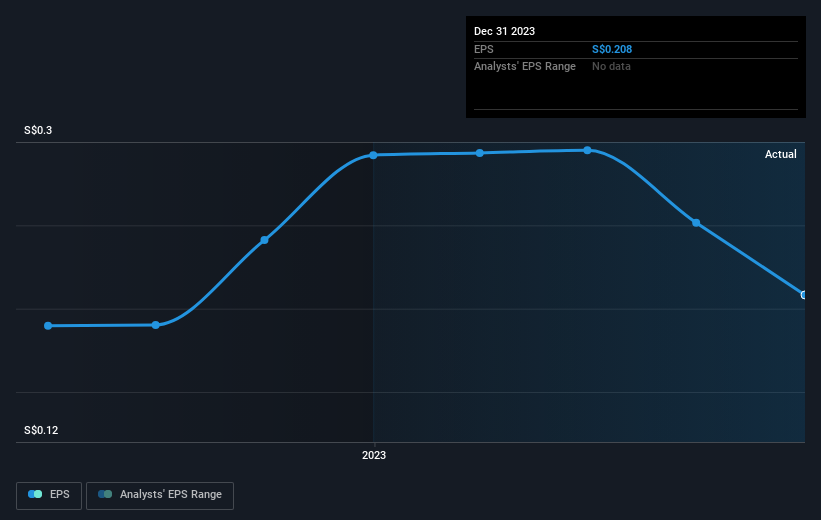
It might be well worthwhile taking a look at our free report on Hong Leong Finance's earnings, revenue and cash flow.
What About Dividends?
It is important to consider the total shareholder return, as well as the share price return, for any given stock. The TSR incorporates the value of any spin-offs or discounted capital raisings, along with any dividends, based on the assumption that the dividends are reinvested. Arguably, the TSR gives a more comprehensive picture of the return generated by a stock. As it happens, Hong Leong Finance's TSR for the last 5 years was 16%, which exceeds the share price return mentioned earlier. The dividends paid by the company have thusly boosted the total shareholder return.
A Different Perspective
Hong Leong Finance provided a TSR of 3.0% over the last twelve months. Unfortunately this falls short of the market return. On the bright side, the longer term returns (running at about 3% a year, over half a decade) look better. Maybe the share price is just taking a breather while the business executes on its growth strategy. I find it very interesting to look at share price over the long term as a proxy for business performance. But to truly gain insight, we need to consider other information, too. Even so, be aware that Hong Leong Finance is showing 1 warning sign in our investment analysis , you should know about...
Of course Hong Leong Finance may not be the best stock to buy. So you may wish to see this free collection of growth stocks.
Please note, the market returns quoted in this article reflect the market weighted average returns of stocks that currently trade on Singaporean exchanges.
Have feedback on this article? Concerned about the content? Get in touch with us directly. Alternatively, email editorial-team (at) simplywallst.com.
This article by Simply Wall St is general in nature. We provide commentary based on historical data and analyst forecasts only using an unbiased methodology and our articles are not intended to be financial advice. It does not constitute a recommendation to buy or sell any stock, and does not take account of your objectives, or your financial situation. We aim to bring you long-term focused analysis driven by fundamental data. Note that our analysis may not factor in the latest price-sensitive company announcements or qualitative material. Simply Wall St has no position in any stocks mentioned.
